02
Market IntelligenceState Intelligence

MARKETCOLOR.

Know the state of the market before you commit to it.

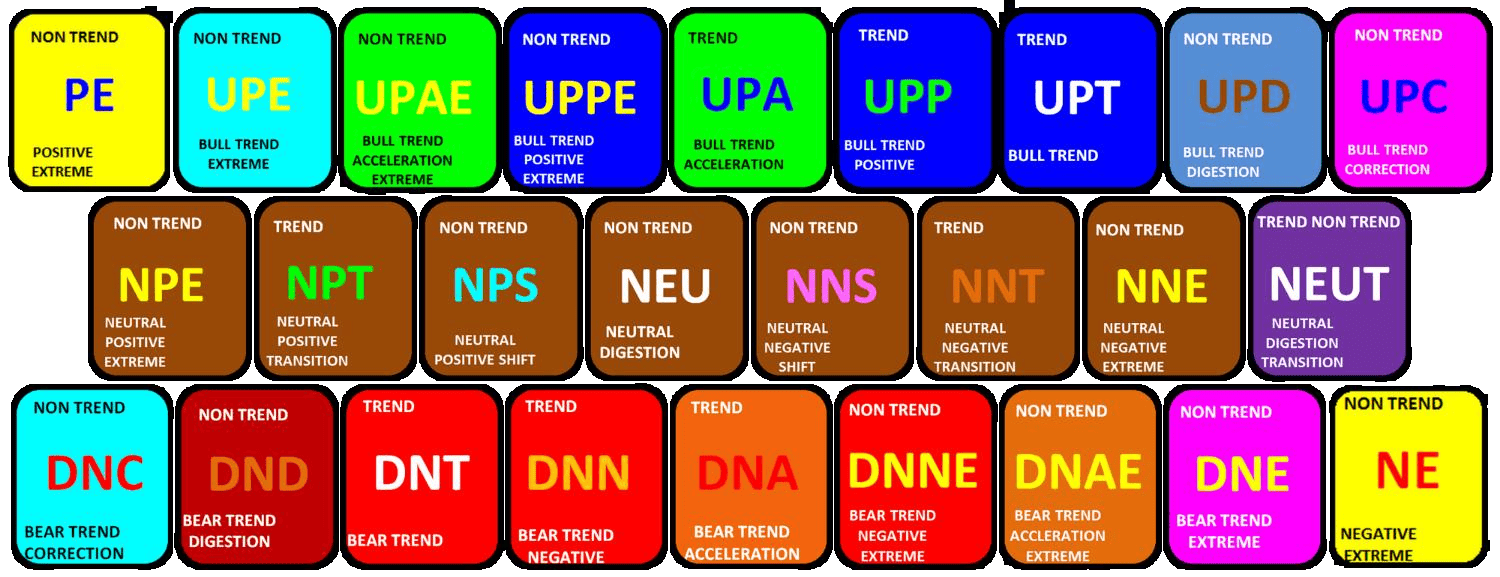
Most traders see two states: trending, or not. MarketColor sees 26. It reads the market’s current condition — momentum, bias, volatility, type — and names it, in color, for every market, every day. The same read, on every chart you trade.

The 26 MarketColor signature states — each tile shows its code, its name and whether it is a trend or non-trend condition
The 26 signature states · trend, non-trend, extreme, transition
26 Signature States · 500+ Markets · Daily · Weekly · Monthly
01 · Why Condition Matters

YOU HAVE TRADED EVERY ONE OF THESE STATES.
MOST TRADERS ONLY NAME THEM AFTERWARD.

General State
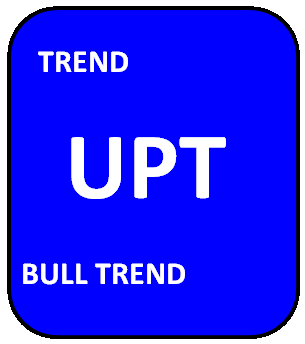
UPT tile — Bull Trend
“The market is in a bull trend. Today was a correction and a big squeeze, and it got me. Nothing about the bull trend has changed — only my position is lighter.”

Most traders see state as a general condition: trend or non-trend. Markets are more complex than that. Every general state holds a set of signature states, each with its own behavior — and that granularity is where the read lives. Read these three as “bull trend” and you will press into a pause and chase into a correction.

Signature State · three of twenty-six · illustrative
UPA tile

Momentum is expanding and the pace is picking up. Pullbacks are shallow and short. Continuation is the expectation; the risk is chasing it late.

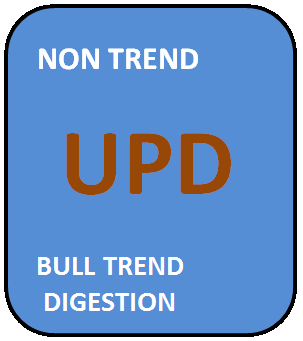
UPD tile

The trend pauses to absorb its gains. Price moves sideways in a range above prior structure. Patience is the play — the trend has not ended, it is resting.

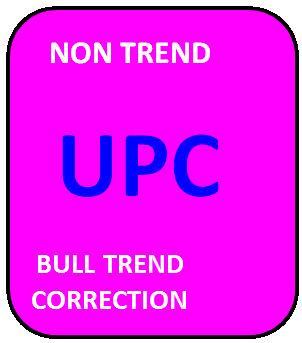
UPC tile

Price gives ground inside a positive context. Sharp, emotional moves against the trend. A pullback, not a reversal — until structure says otherwise.

You are not reacting to events and chasing opportunity.You are anticipating price behavior and participating in it.

02 · Put MarketColor to Use

TRADE THE STRATEGY.
LET THE STATE FIND THE MARKET.

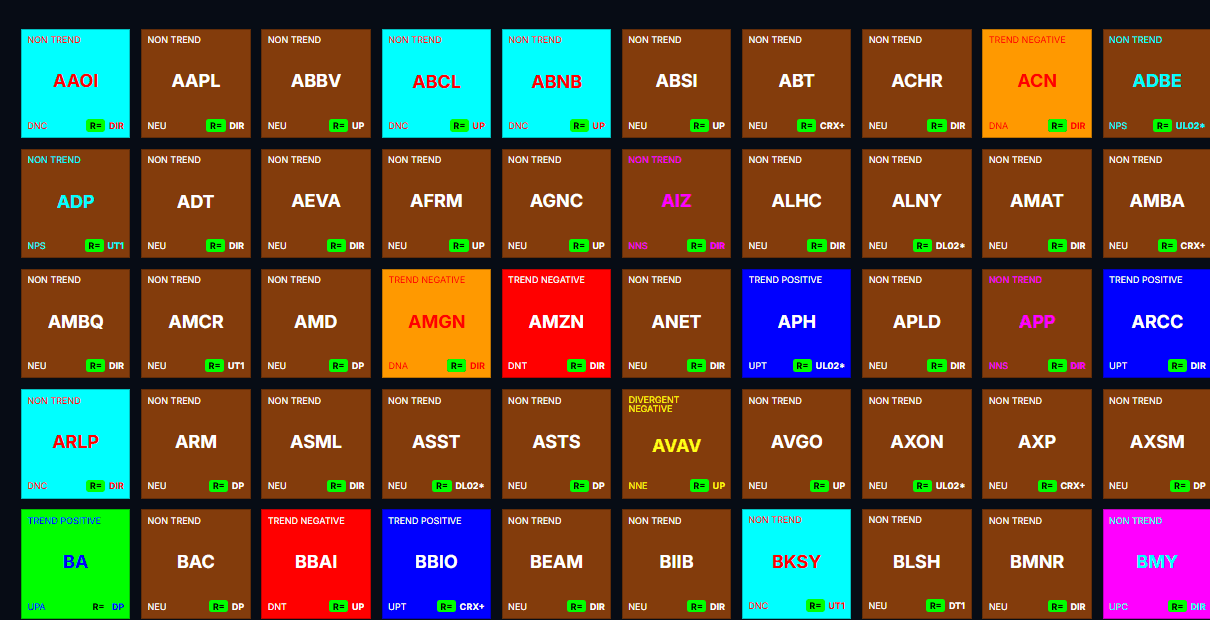
A breakout strategy and a correction strategy need opposite conditions. Start with the strategy you trade; the state tells you where it belongs. The grid shows every market by its condition. The ranking table sorts them by the measure that matters to you.

MarketColor Grid
Example stock grid with every symbol colored by its market state
Example view · stocks colored by market state · not a live read
MarketColor Ranking Table

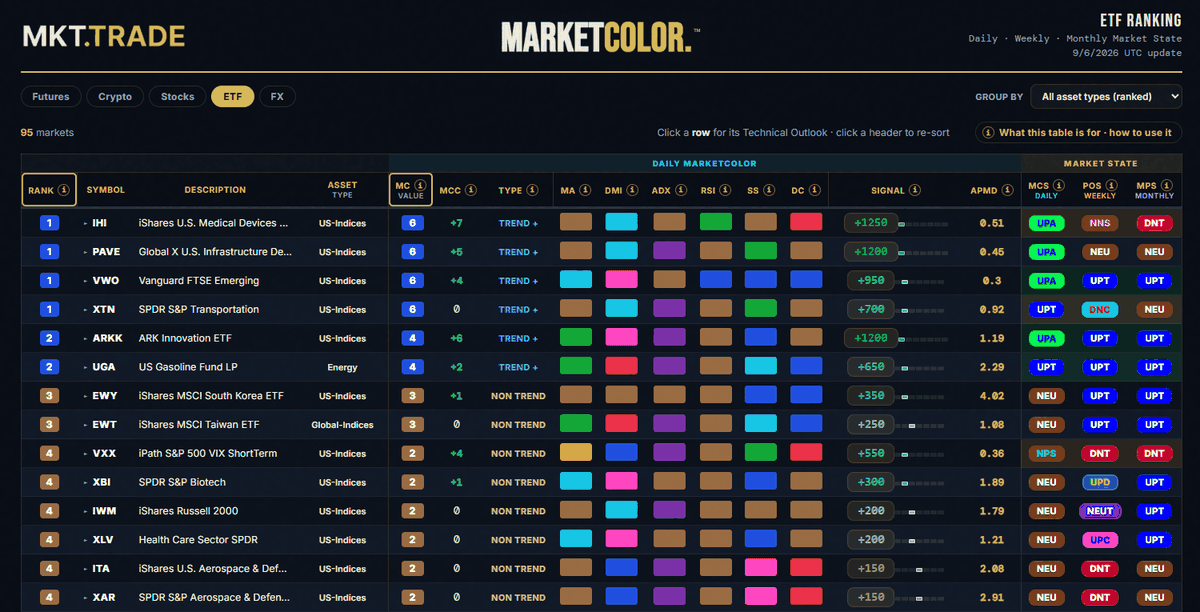
The MarketColor Ranking Table lets you compare and sort markets by their technical condition — from trending and accelerating to correcting or moving sideways. Start with your strategy, then find the markets in a state that supports it.

Example ETF ranking table — markets sorted by MarketColor Value, with MCC, type, the six indicator colors, signal, APMD and the daily, weekly and monthly states
Example ranking view · not a live read · the highest rank is not automatically the best fit for every strategy
Open the Rankings → No sign-up required
03 · One State, Up Close

EVERY TILE IS
A COMPLETE READ.

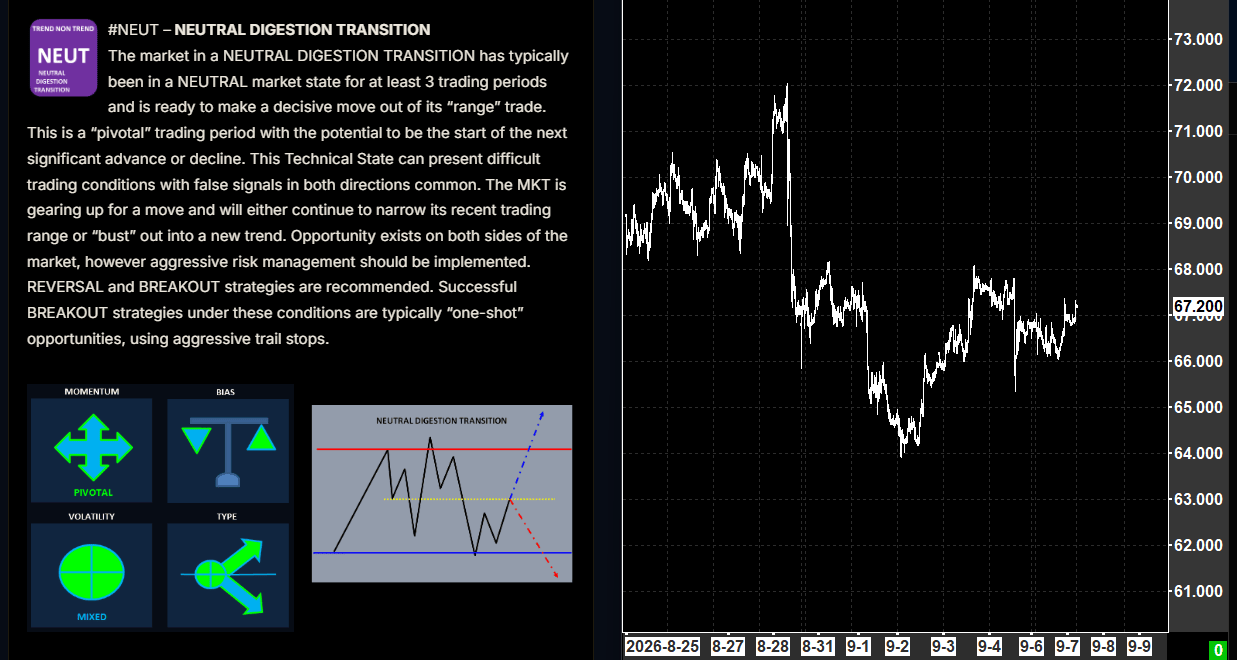
Open one state — NEUT, Neutral Digestion Transition — as it appears in the Playbook, beside the chart it was called on.

A daily chart with PriceMap levels beside the Playbook State tab for Neutral Digestion Transition — the state, its attributes and its expected behavior, read against live price
Playbook State tab · NEUT · example, not a live read
The Commentary

What the market should do if it performs to its state, the tells that confirm or deny it, and the contingency when it transitions. The strategy themes and the risk posture that fit the condition — written before the session, so you are not working it out under pressure. And it is unified: any market, any asset class, in NEUT carries the same expectation.

A NEUT is a NEUT in any market, any asset class.Same state, same expectation, same read. That is the power of the process.

04 · Built for the Trader

IT STARTS WITH YOU.
NOT THE MARKET.

The strategy you can follow under pressure is the one built around how you actually behave under risk.Four steps, in order.

01
Self-Awareness

How you operate under risk — where you press, where you freeze, where discipline breaks.

02
Trade Plan

A strategy, a mandate and a risk limit aligned with who you are. Rules you will keep.

03
State Alignment

The market conditions that complement that strategy — where it is built to work.

04
Market Selection

The markets in those states, today. That is what the grid and the rankings are for.

Step 01 · Free
START WITH SELF-AWARENESS.

The Personality Profile maps how you behave when capital is at risk — the tendencies that decide whether a plan survives contact with the market. Your report is generated the moment you finish, and it is what Navigator calibrates to when you subscribe. Ten minutes. The first input to a trade plan you will keep.

Ten minutes · free
Report on completion
Includes Education Foundation access
Take Your Free Assessment →
05 · The Stack

STATE. STRUCTURE.
STRATEGY.

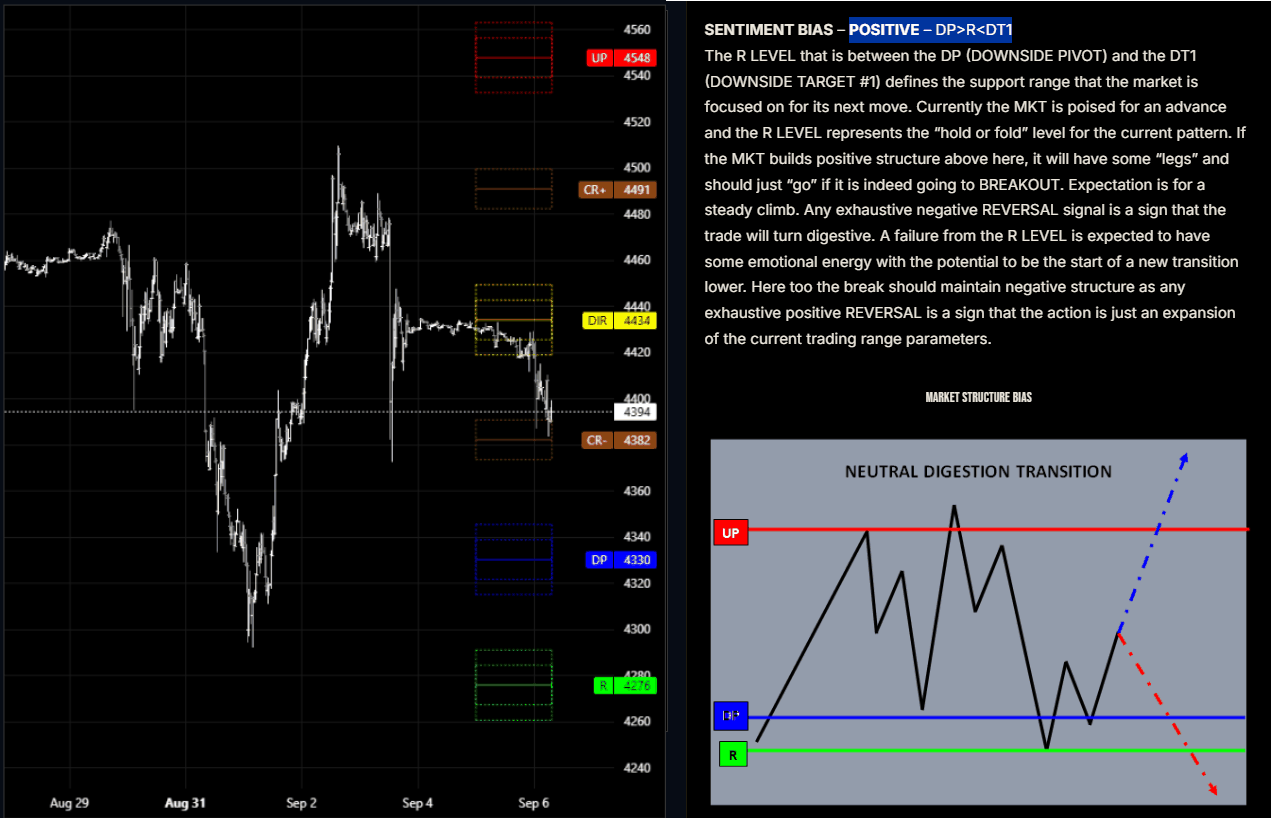
A state holds while its structure holds. MarketColor identifies the condition. PriceMap supplies the levels where the market decides — persist and stay aligned with the state, or break structure and transition to a new one.

Playbook Structure tab for PAXG in a Neutral Digestion Transition — PriceMap levels on the chart beside the Sentiment Bias read and the Market Structure Bias diagram
The Playbook · Structure tab · PAXG in transition, with the levels that decide it · example, not a live read

Same state, different structure, different expectation. A UPT with sentiment below the market is trending. A UPT with sentiment above the market is corrective. The state names the condition; structure sets the expectation.

State tells you the kind of market you are in. Structure tells you where that state holds, and where it breaks.One without the other is half a read.

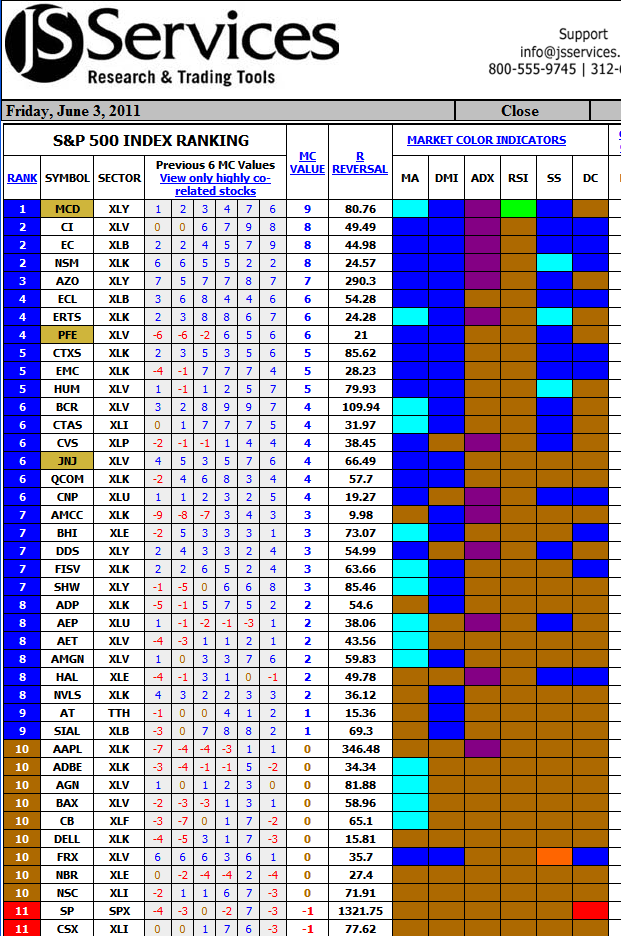
Original JS Services S&P 500 stock ranking table dated June 3, 2011
JS Services S&P 500 stock rankings · June 3, 2011

06 · Origin Story

WHY I BUILT MARKETCOLOR.

By the late 1990s, SOES stock traders wanted the analytics we applied to the major indices across lists of 50 or 100 individual names. The manual process could not scale.

I did not need another signal or trading system. I needed an objective answer to a more basic question: What state is each market in?

I built MarketColor to classify that condition — trending or nontrending, pivotal or extreme, accelerating or corrective — and organize a large market universe around those states.

That changed the process. Instead of starting with a market and searching for a trade, I could start with the state and focus on the strategies built for that condition.

That remains MarketColor’s role inside MKT.TRADE: define the state first, so the Playbook can frame the Strategy Themes expected to influence price action.

THE GOAL WAS NOT TO FIND A SYSTEM.
IT WAS TO FIND THE TRUTH.
John Slazas · Founder, MKT.TRADE

Start With the Context

PUT MARKETCOLOR
TO WORK.

Two weeks free · Cancel inside the trial, owe nothing

MarketColor defines what kind of market you are in. The next layer defines what to do in it.

Next · Playbook
Strategy Themes
Structure plus state equals strategy theme. Optimal, Hedge, or stand aside — before you trade.