Is the August rally for real? Structure answers that before opinion does. Here is what’s true across the time frames — and the decision it puts in front of anyone already holding.
Structure defines what is true before opinion takes over — so start with the facts, not a view. Bitcoin reclaimed its prior-year low in August and has held above it. On the quarter it broke out of its Critical Range and is holding the validation of that break. Those levels were set on the map before price ever arrived at them. What follows is the read across the time frames, built to one bottom-line truth — and the decision that truth hands the operator: hedge the rally, or accumulate into it.
The Yearly — The Foundation
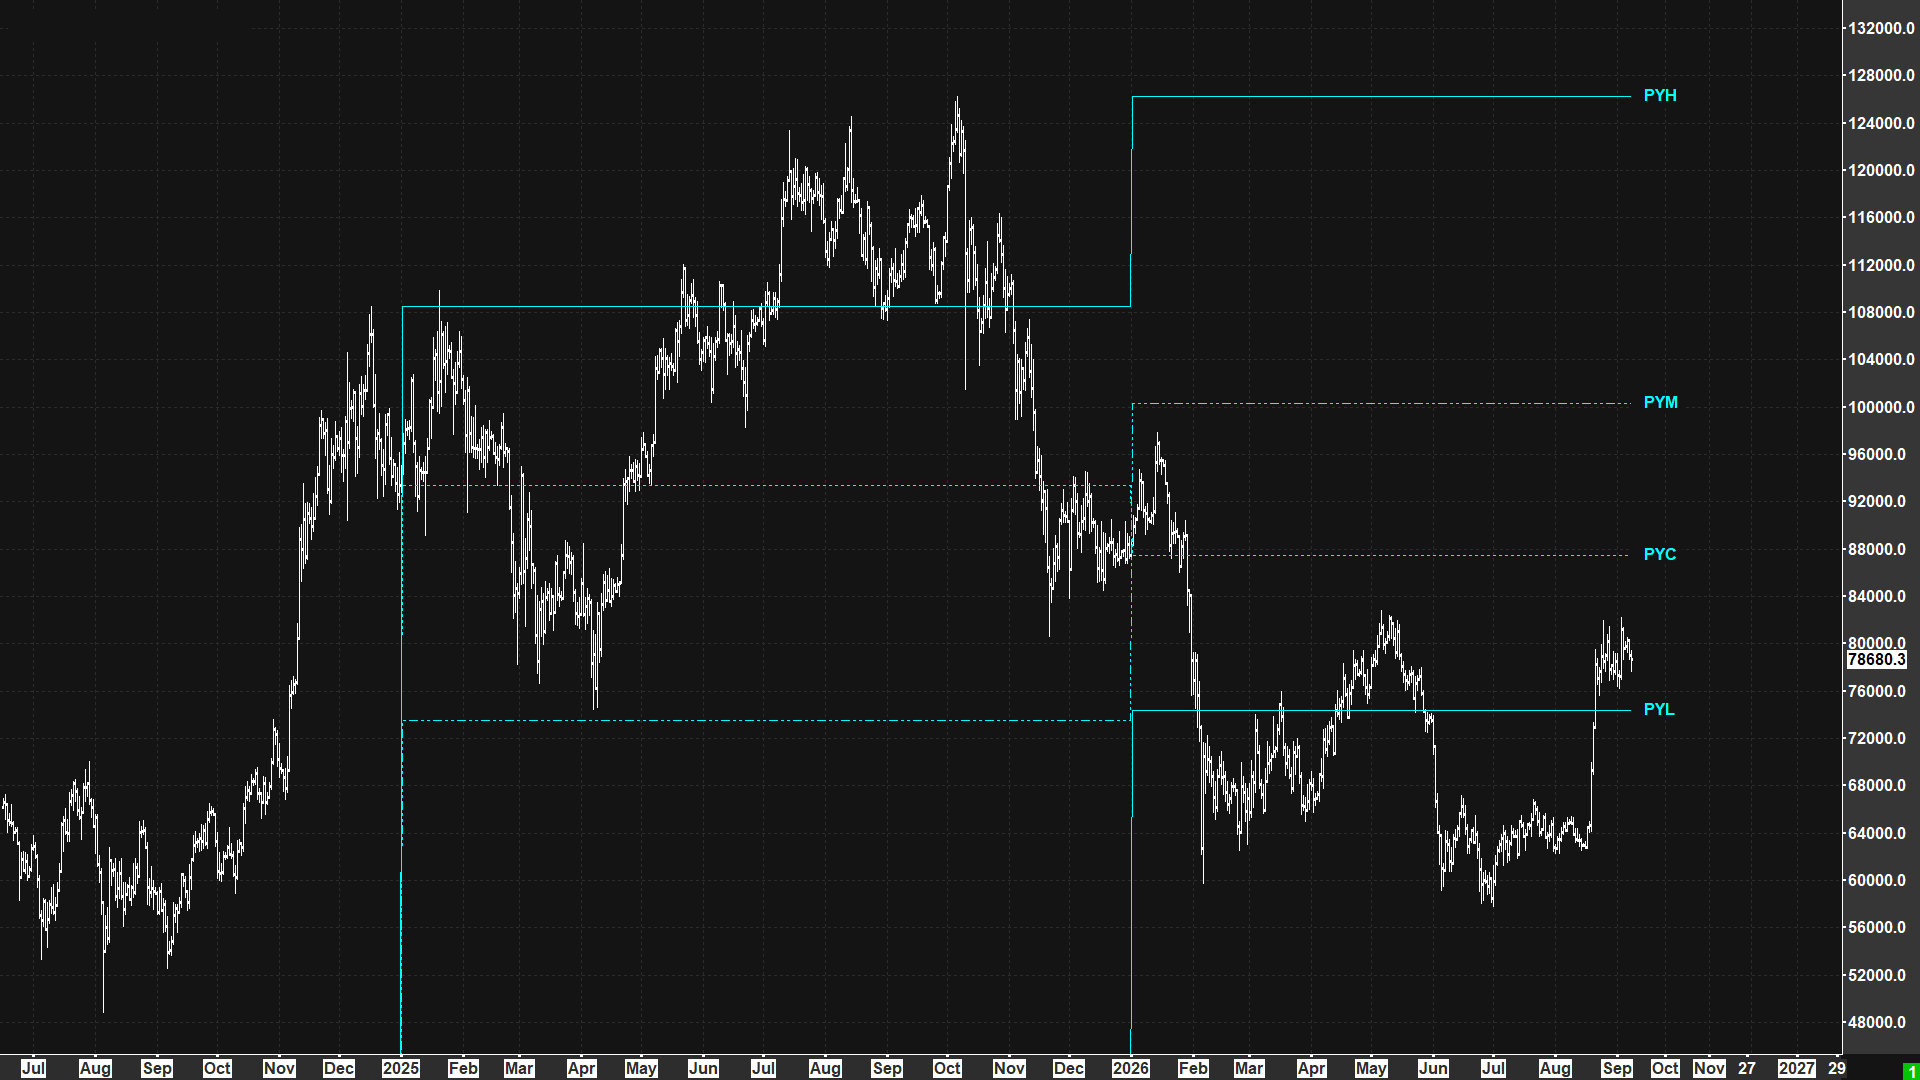
The widest frame sets the context; it doesn’t drive the trade. The Yearly time frame is fixed by four references carried from last year: the prior-year high (PYH) near 127,000, the mid (PYM) at 100,358, the close (PYC) at 87,498, and the low (PYL) at 74,420. The fact that turned in August is the PYL: price reclaimed it and has stayed above. May was the failed attempt — a push that couldn’t hold and fell back into the base; August reclaimed and held. Above the PYL the Yearly Sentiment Bias points up, and the references overhead are the PYC and the PYM.
The Yearly time-frame structure — the foundation. Four fixed references carried from last year: PYH, PYM, PYC, and the PYL at 74,420 that Bitcoin reclaimed in August.
Market Structure — The PriceMap Critical Range and the R Level
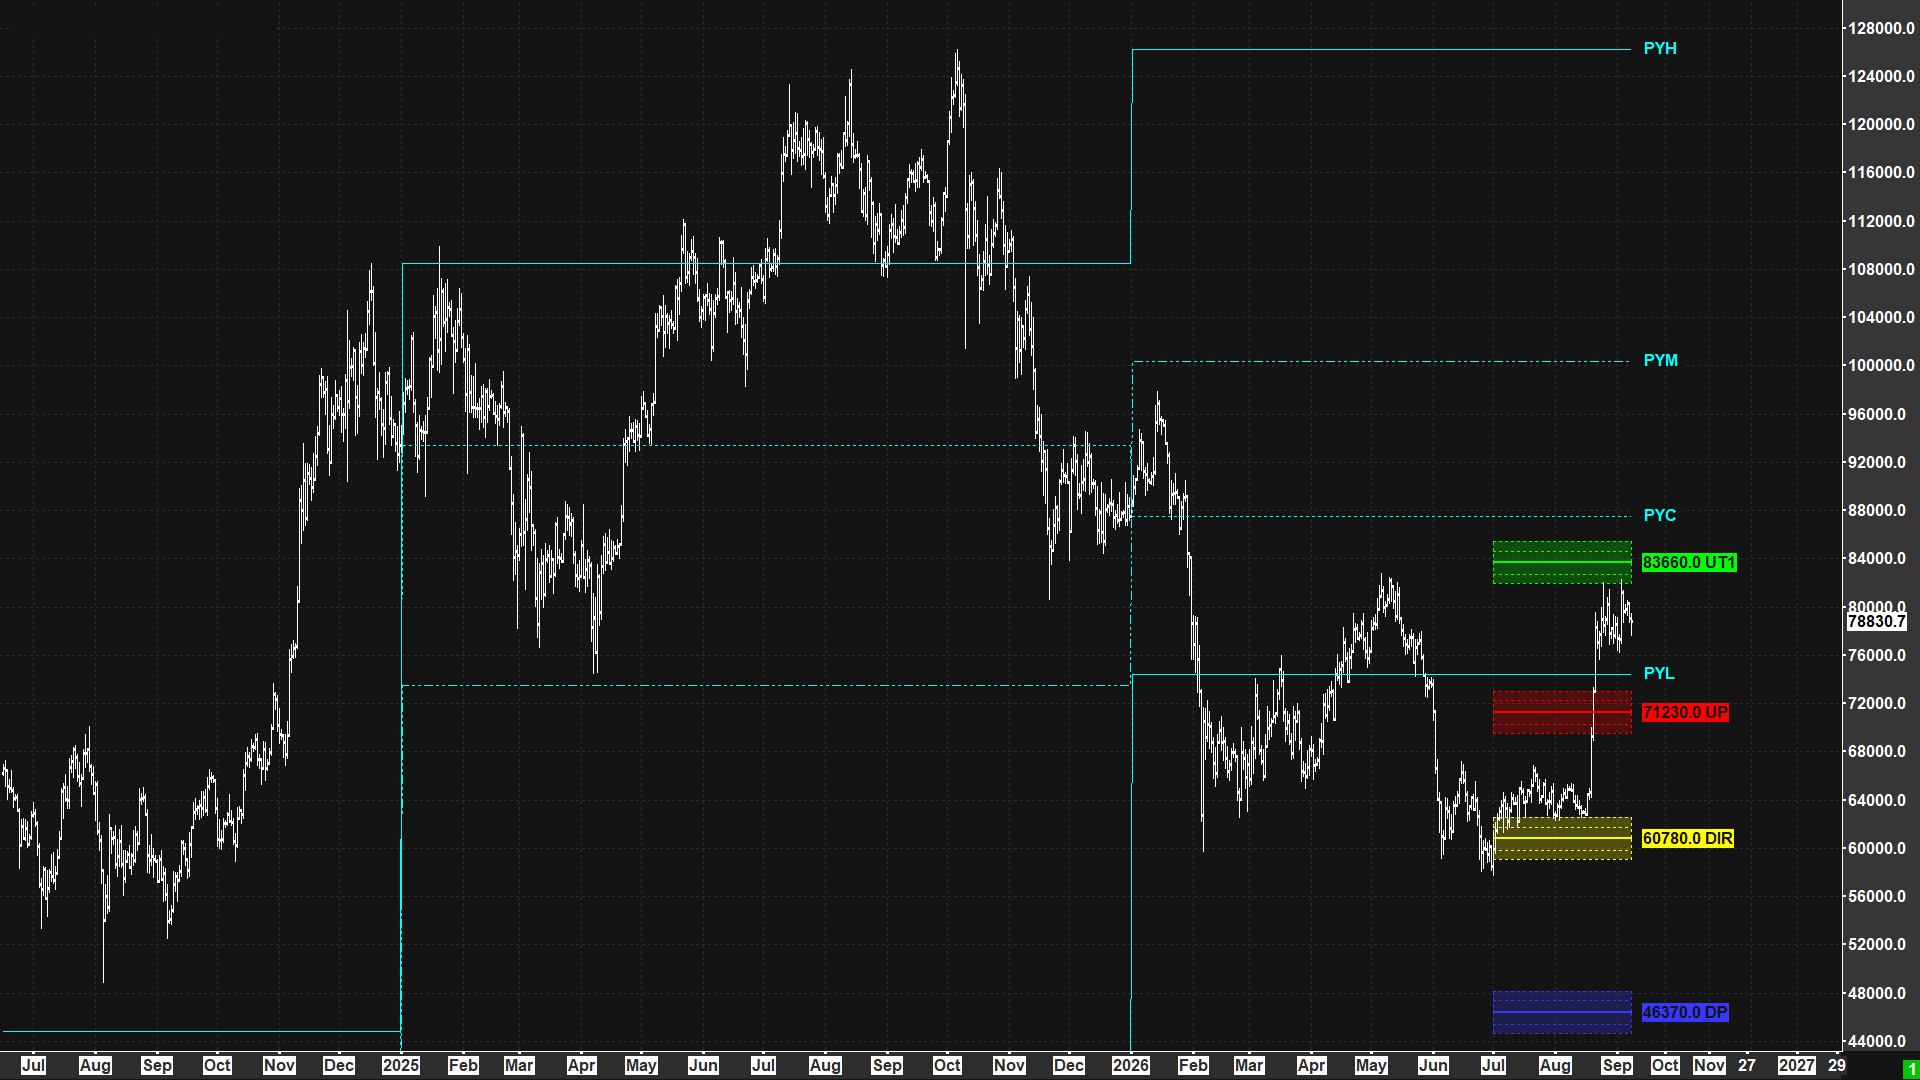
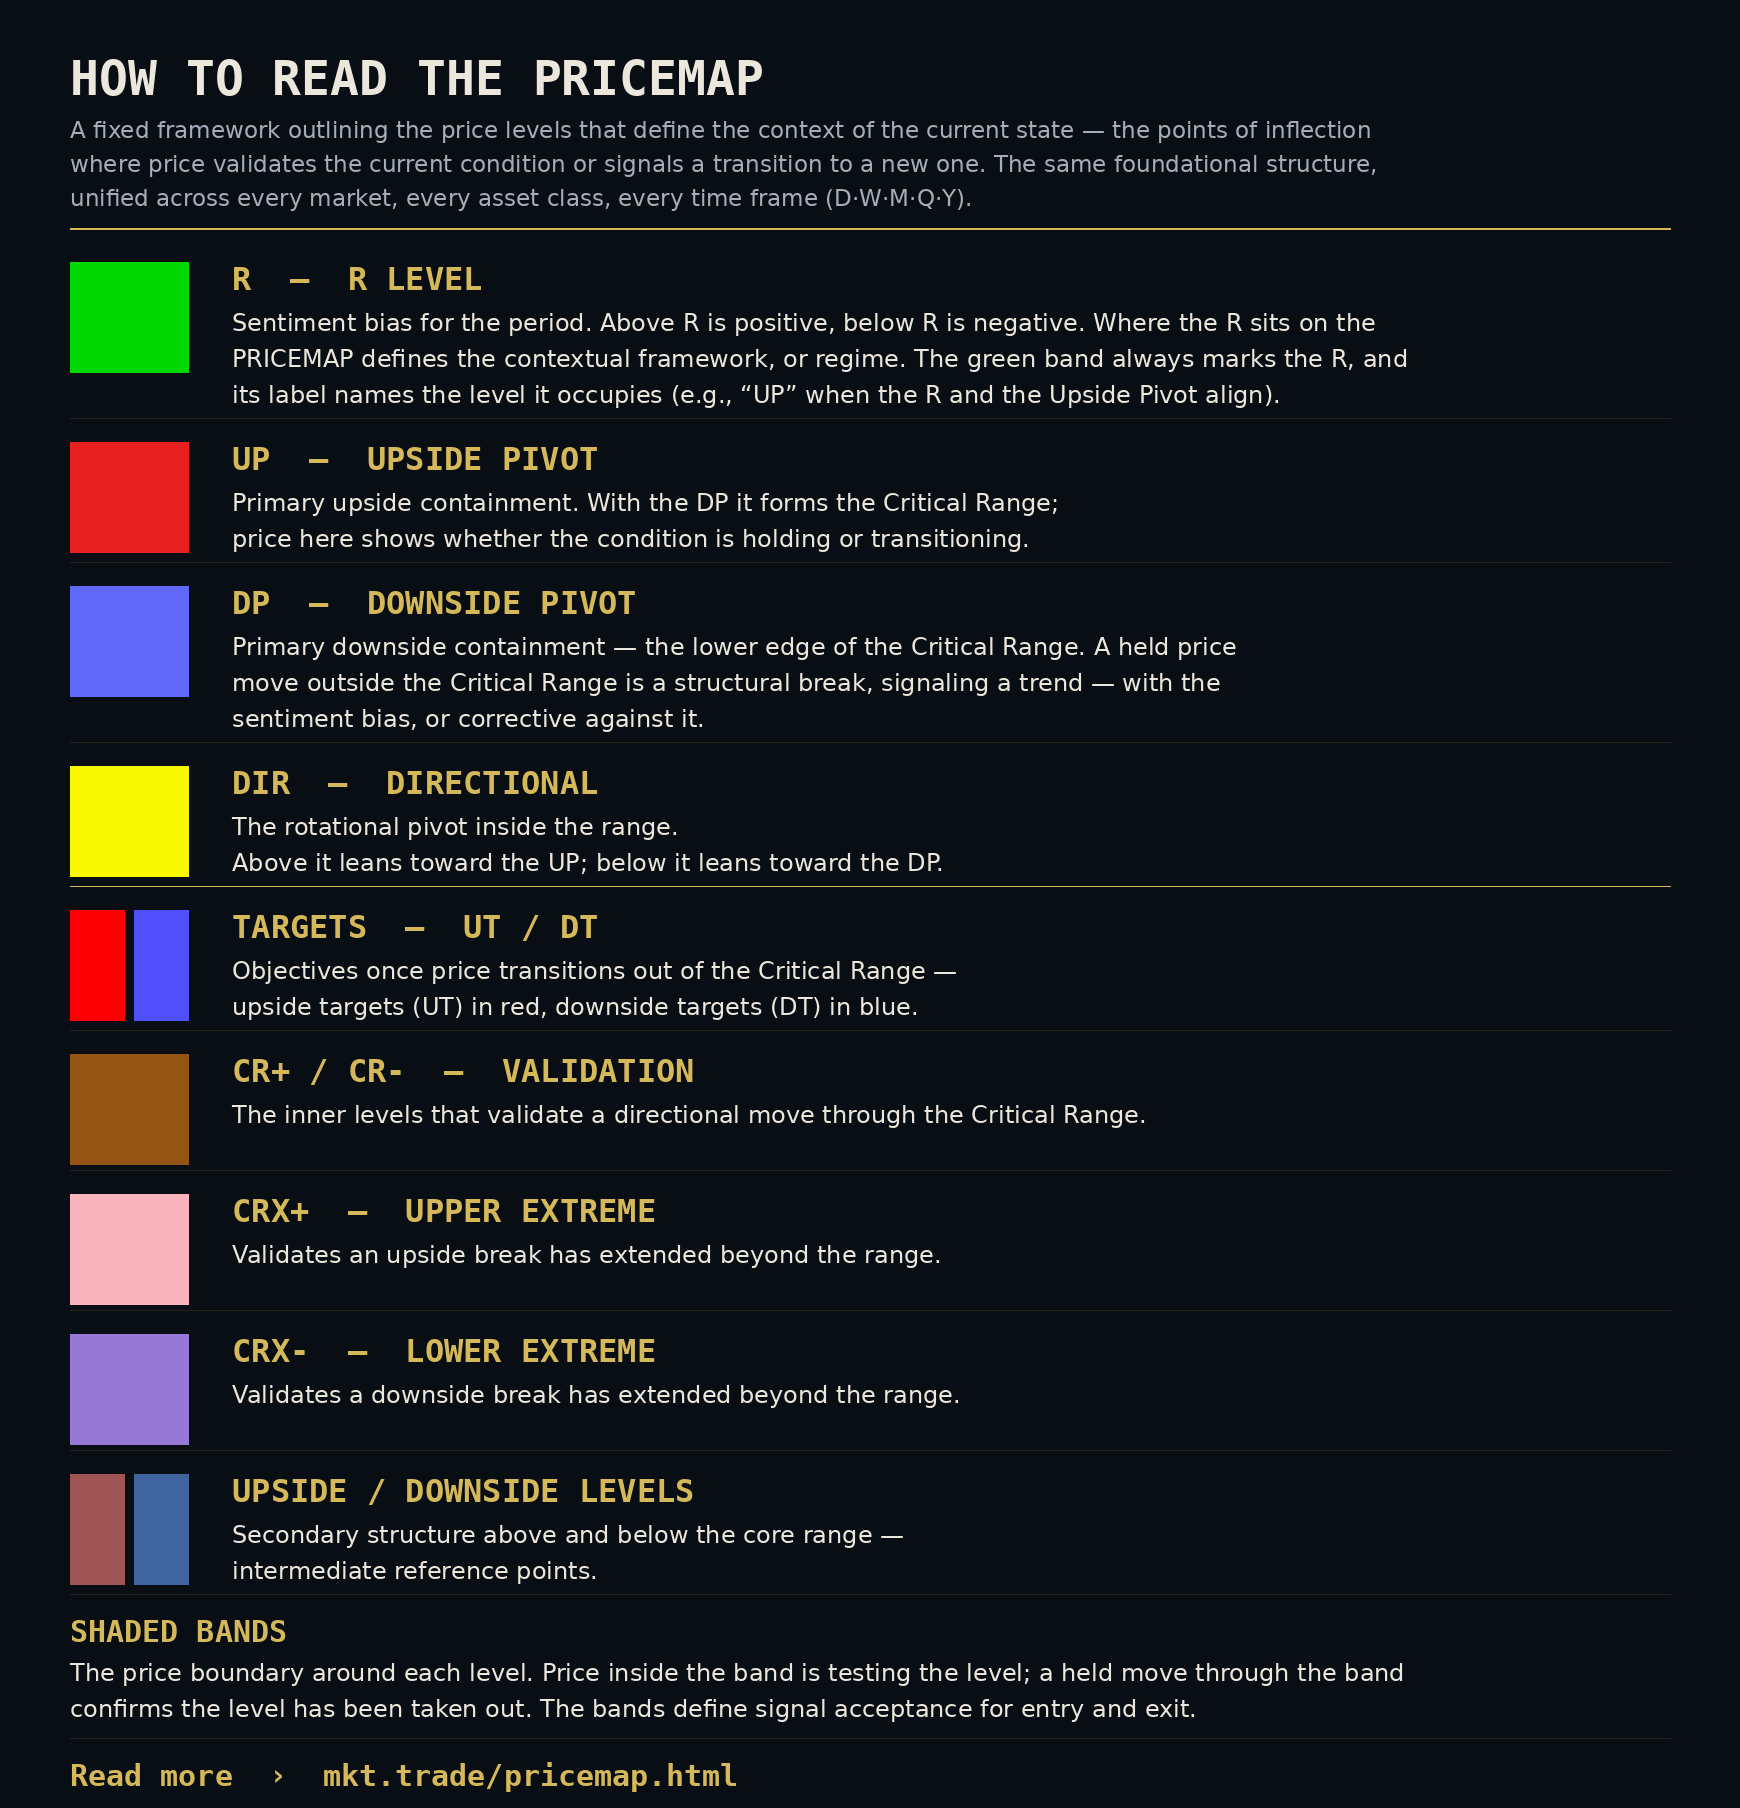
Market Structure is the base framework supporting all market studies, indicators and methods. We call it the PriceMap. It’s one method, unified across all markets, asset classes and time frames, and can be applied to whatever duration your trading tactics works in. In this example we are applying the Quarterly PriceMap with the Yearly Time Frame structure. If you are new to the PriceMap, a color-code key sits right below the chart.
The PriceMap market structure drawn on Bitcoin — the Critical Range (UP 71,230 over the DIR 60,780), the R at 83,660, and the validation levels around them. The same framework sets the Quarterly PriceMap the read runs on.The PriceMap key — what each level and colored band represents.
The Read
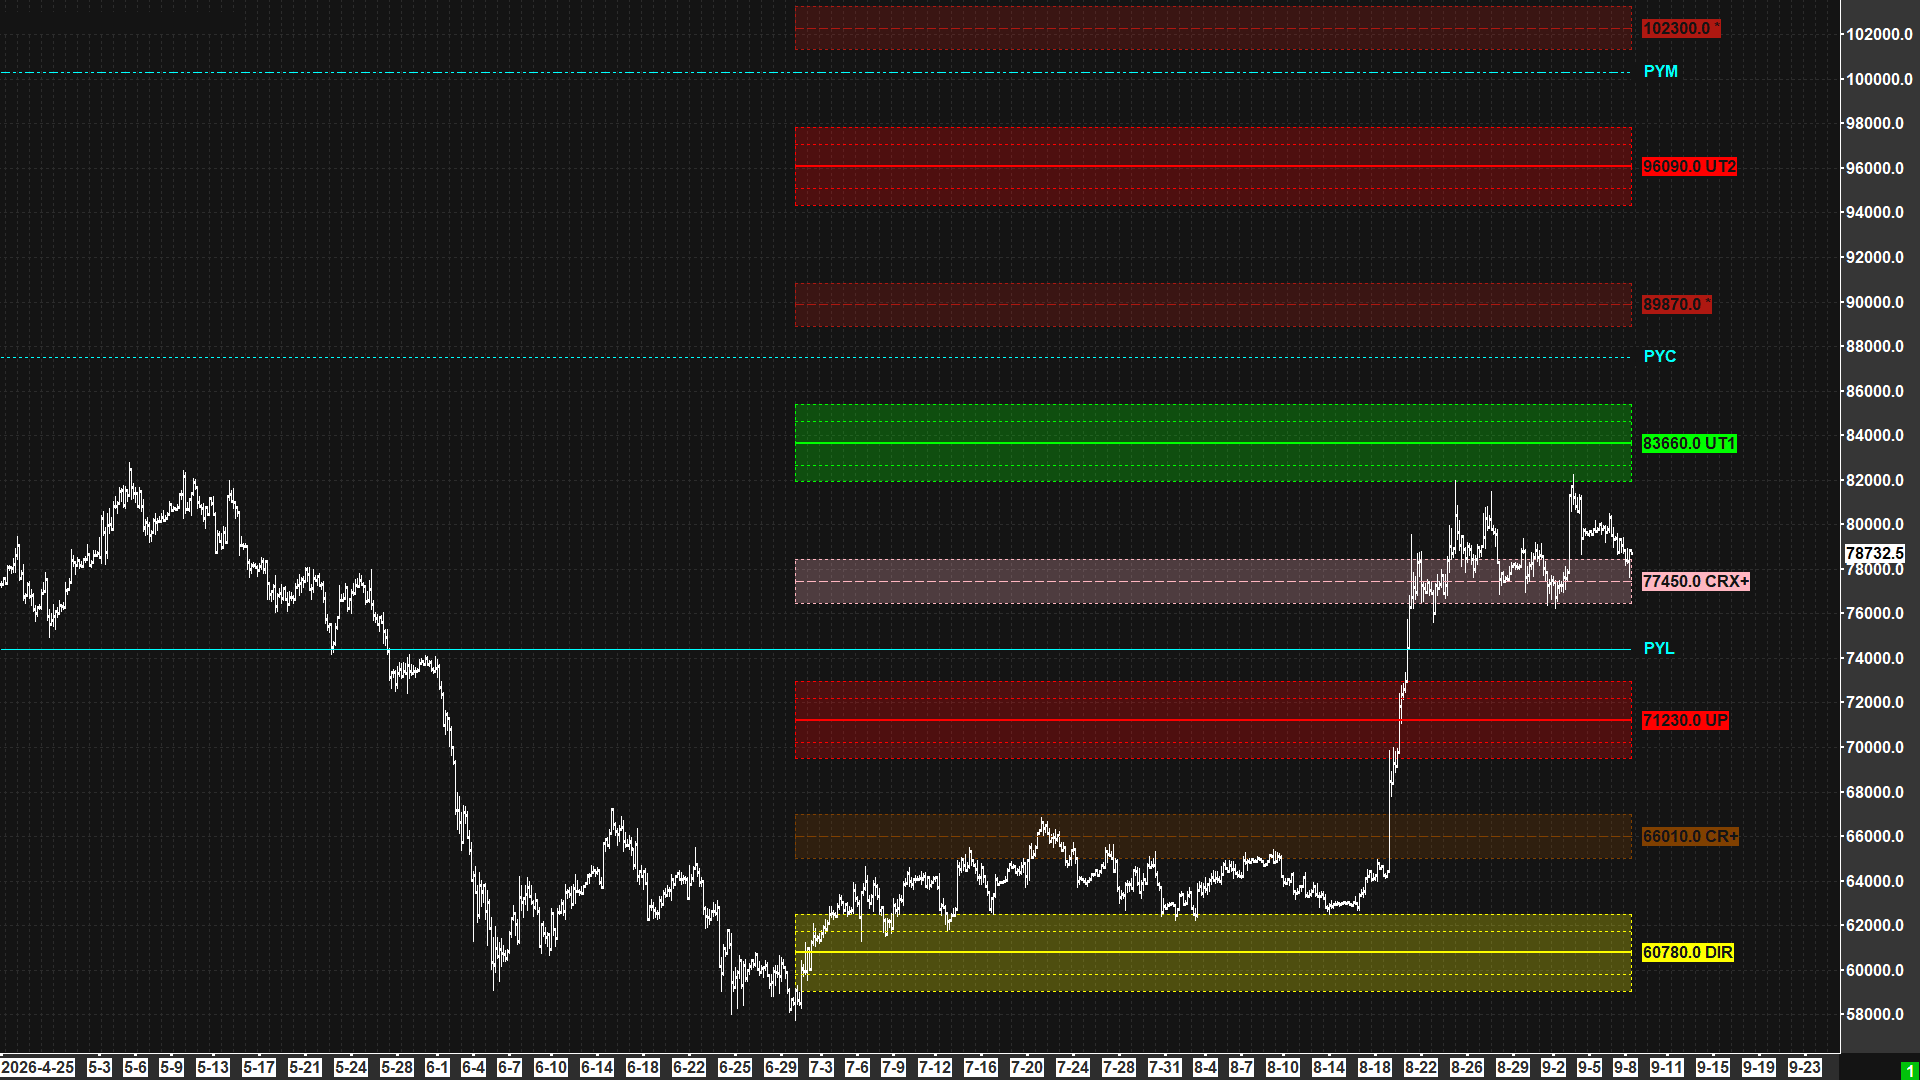
The Quarterly PriceMap was set on July 1. Bitcoin opened the quarter in a regime with sentiment above the market at 83,660 — a negative bias. In that condition, price needs to stay below the 60,780 DIR pivot to perform to the negative expectation. A trade above the DIR is a sign price does not agree with that sentiment, shifting the market into a corrective posture. This is a Hedge theme — specifically a BUY DIR BREAKOUT hedge strategy — and it first broke out above the 71,230 UP (a BUY UP BREAKOUT), then attained the 83,660 R Level. Typically a move into sentiment is an optimal SELL R FADE, and that opportunity has already paid out twice, producing two half-segment reactions back to the 77,450 CRX+. Neither reaction broke price structure (higher lows) or market structure (the CRX+ lower metric boundary) — keeping the corrective momentum off the DIR and the UP breakout intact and in command.
The full Quarterly PriceMap — the complete structure both courses are read against. The R at 83,660, the 77,450 CRX+ validation holding under price, the PYL at 74,420, and the Critical Range beneath.
Reading price action through market structure, in the context of the previous Yearly time frame, gives a clear picture of the current condition. The Quarterly 77,450 CRX+ and its metric boundary is the point of inflection defining Bitcoin’s price action for the balance of the month. The expectation is a hold and repeated tests of the 83,660 UT1 R Level as the market fights to reclaim its PYC. How the market reacts off 83,660 when tested is the upside tell — a transition to a positive regime change, or not. A break under the CRX+ lower metric boundary is more a tap on the brakes than a turn, signaling a pause in the corrective rise, with the PYL holding the final say on the vulnerability to a serious profit giveback of the Q3 advance. Any structure break is more likely a signal the market will “wait and see” for the new quarterly and monthly structure reset on the 1st. No break in structure, and the path is defined.
Hedge or Accumulate
That is what’s true. What you do with it is yours to decide — it turns on the position you already carry, your objective, your risk tolerance and your treasury needs. Two courses come off the same facts. The structure anchors both; it doesn’t choose between them. The construction of each is below — what the strategies do by definition, not a recommendation.
Course A
Hedge the rally
Hold the spot core; neutralize the giveback if the SELL R FADE plays and price rejects the R back toward the PYL.
Futures / Perp
Short a perpetual or dated future against the spot core. Structure is holding, so the market isn’t saying you’re at risk. Below the CRX+ boundary there’s a concern; under the PYL, a potentially larger problem. Have a plan for a rally — a third strike at the UT1 R, and a possible capitulation there — to lock in gains. Using shorter time frame market structure within the quarterly structure can improve your timing.
Options
A collar: buy a put at the PYL, write a call at the R. The put insures below the failure point; the call, written at the upside containment R, finances that protection and caps upside at the same level the structure says to fade. By definition it brackets the position — protected below the PYL, capped at the R. If the call is assigned, the spot is sold into strength at the R — the outcome the fade points to anyway. It is best to do this into a rally, where the calls are richer and the puts cheaper.
Course B
Accumulate the reclaim
Build on the structure; define where you’re willing to acquire, and how you ride a transition through the R.
Spot / Perp
Accumulate spot off the structure. The CRX+ holds the key to the momentum — that’s the defined risk. Yes, the market can trade down to the PYL and it’s still good, but the true momentum holds above the CRX+. Don’t buy into the UT1 R and hope for a breakout. If you’re not on board when it’s there, wait for the violation, then buy the pullback. If you are on board, aggressively protect what you have and re-enter on a transitional signal if your profit trails get hit.
Options
A cash-secured put sale at the PYL: by construction you commit to acquiring at the level you already want to own, and the premium is your compensation for that commitment — assignment is the accumulation, at the PYL. A tail put written below caps the downside event risk on it. For the upside, any call spread from the R toward the PYC defines the risk on a transition through the R — a bounded long, no leverage. Pairing the short put with a long call is a risk reversal: the downside commitment finances the upside.
The deciding facts
CRX+ boundary holdsStructure intact. The corrective rise stays in command — expect holds and repeated tests of the 83,660 R.
Reaction off 83,660The upside tell. How the market reacts at the R signals a transition to a positive regime, or not, and the fight to reclaim the PYC.
Under the CRX+A tap on the brakes, not a turn — a pause in the corrective rise.
Under 74,420 PYLThe final say — vulnerability to a serious giveback of the Q3 advance.
Any structure breakWait-and-see into the October 1 quarterly and monthly reset. No break, and the path is defined.
Bottom Line
Hedge or accumulate is your call — your objective, your risk, your treasury. Every operator carries a different position and a different mandate, and the structure doesn’t make that choice for you. It defines the facts. You execute.
Structure first. Define what’s true, then execute. You stay the operator.
— MKT.TRADE
The structure behind the read
Every level here comes off the PriceMap — the same fixed structure set on every market and every time frame, Daily through Yearly, before the period opens and unchanged until it closes. It’s how the R Level reads on any time frame. See how the map is built on the PriceMap page →
Educational and informational content on market structure. Not financial advice, a trading recommendation, or an execution signal. The collar, cash-secured put, tail hedge, risk reversal, call spread, spot, margin and perpetual-futures constructions described above are illustrations of how the structure could be approached — they are not recommendations. Selling puts, writing calls, leverage and perpetual futures involve substantial risk, including assignment, margin calls, liquidation, and the risk of losing more than your initial capital. Structure describes probabilities, not certainties. Prices are referenced from delayed data — confirm against live quotes before acting. All decisions remain the sole responsibility of the reader.