01
Layer 01Structural Intelligence

PRICEMAP.™

MKT TRUTH begins with structure.
PriceMap defines what is true before opinion takes over.
PriceMap structure and the nine R regimes The PriceMap ladder from UT4 down to DT4. On the left, the structural names: the event extremes c+ and c- at UT4 and DT4, the upside targets, the upside pivot UP, the critical range, the downside pivot DP and the downside targets. On the right, the sentiment bias R, which occupies one of nine anchors: R1 at DL02, R2 at DT1, R3 at CRX-, R4 at DP, R5 at DIR, R6 at UP, R7 at CRX+, R8 at UT1, R9 at UL02. Colours match the live chart: R in green, UP in red, DIR in yellow, DP in blue. Here R sits at UP, which is regime R6. UPSIDE TARGETS UPSIDE PIVOT DOWNSIDE PIVOT DOWNSIDE TARGETS CRITICAL RANGE EVENT EXTREME · c+ EVENT EXTREME · c− UT4 UT3 UT2 UT1 UP DIR DP DT1 DT2 DT3 DT4 UL02 CRX+ CR+ CR− CRX− DL02 R9 R8 R7 R5 R4 R3 R2 R1 R SENTIMENT BIAS R SITS AT ONE OF NINE ANCHORS · ITS POSITION IS THE REGIME COLOURS MATCH THE LIVE CHART · UP DIR DP
The structure — nine anchors, nine regimes
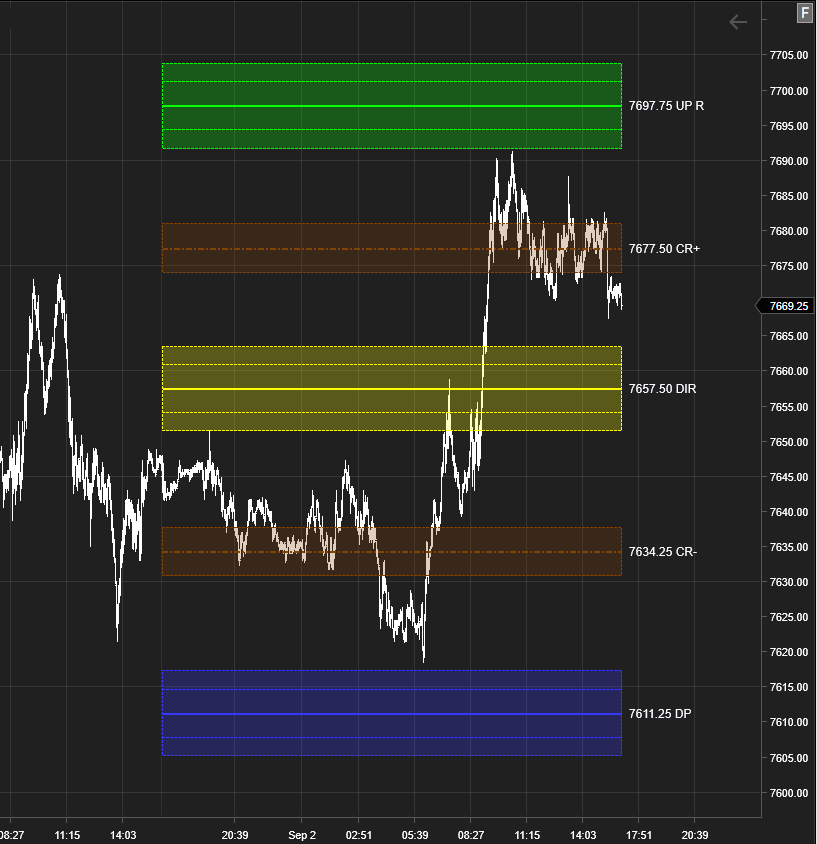
ES futures with the PriceMap levels drawn on a live chart - R at the Upside Pivot 7697.75, CR+ 7677.50, DIR 7657.50, CR- 7634.25, DP 7611.25
The same structure on a live chart — ES
Set before the period opens. Unchanged until it closes.
The fact foundation you trade within.
Reference Levels · Opportunity Zones · Risk Boundaries · Structural Context
The MKT TRUTH Layer

PRICE ACTION
HAS STRUCTURE.

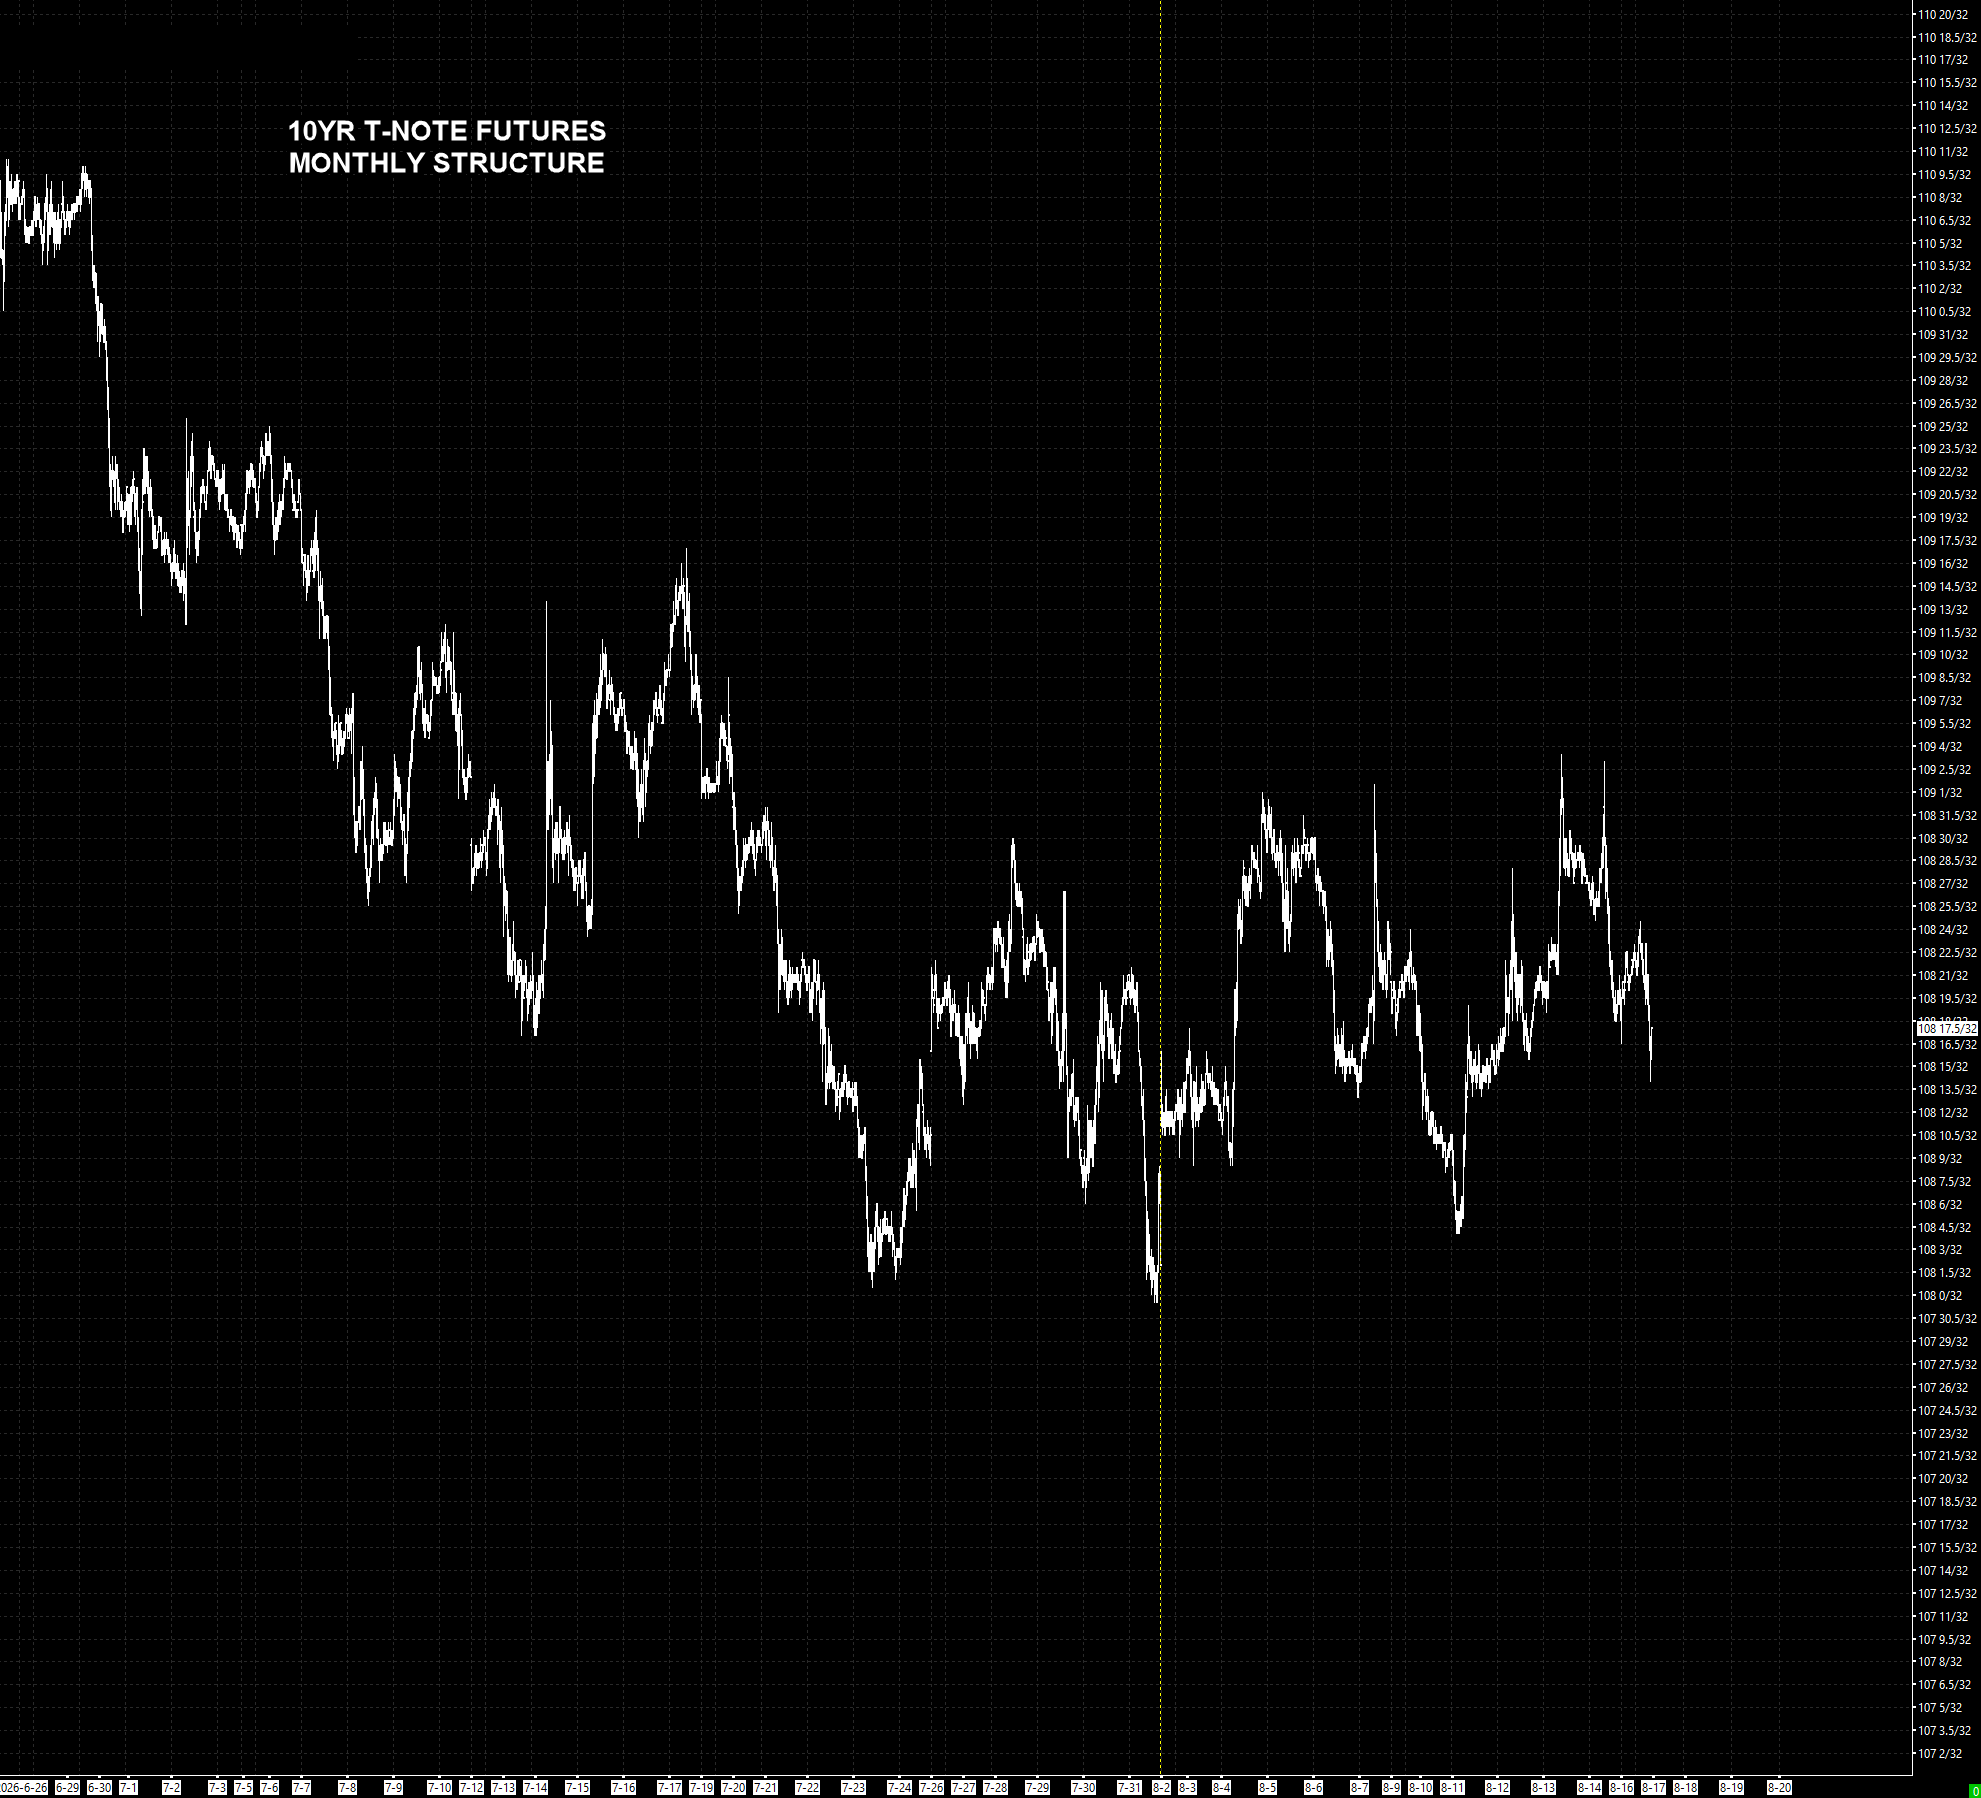
Two charts. The same instrument, the same month, the same prices. The only difference is whether the structure underneath is drawn.

The Problem
Price Without Structure

Most traders know where price is. Fewer know where price matters. Without a structural framework, every level competes for attention — and the decision process becomes reactive instead of objective.

The market has a defined anatomy. PriceMap makes that anatomy visible.

10-Year T-Note futures, monthly - price with no structural levels drawn
10-Year T-Note, monthly. Price, and nothing but price.
The Solution
One Map. Every Method.

PriceMap is a criteria filter for any method. Discretionary, systematic, day, swing, position, arbitrage, spreading, and options workflows all occur inside the same structural framework.

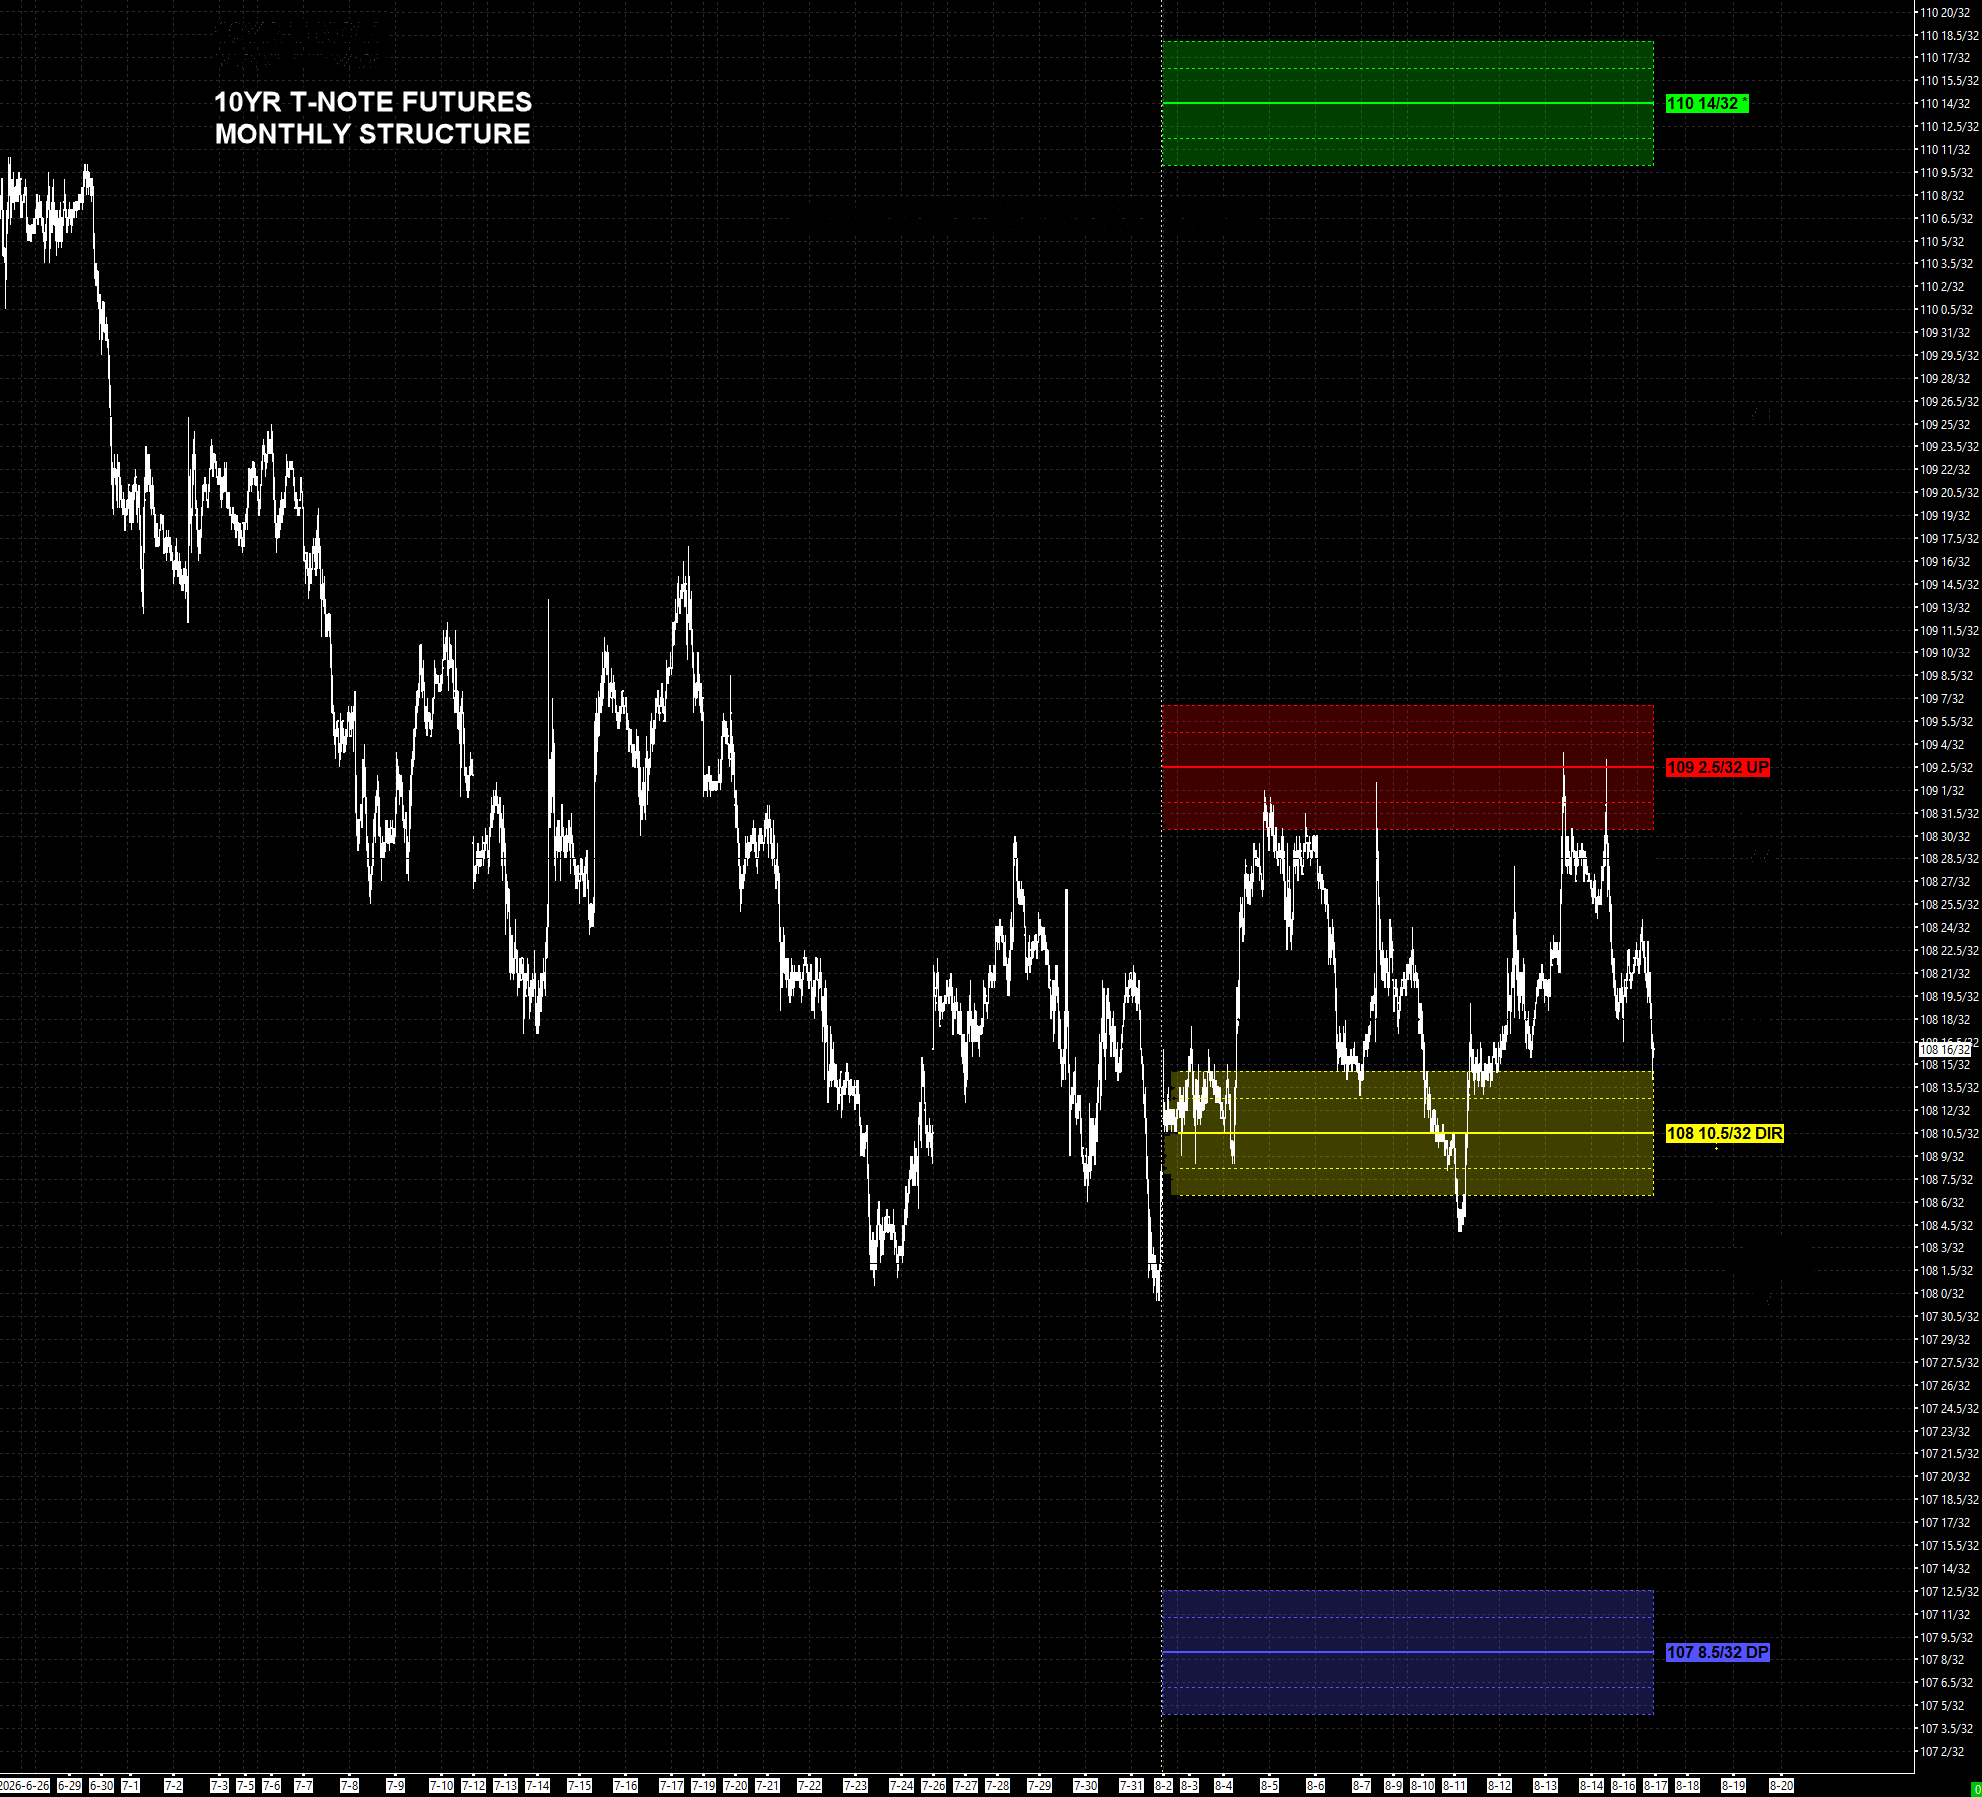
At a glance, the operator can see value potential, risk location, containment targets, breaking points, and transition levels.

The same 10-Year T-Note monthly chart with the PriceMap applied - R sentiment bias in green, Upside Pivot in red, Directional in yellow, Downside Pivot in blue
The same chart, the same month — read through the PriceMap.
The Framework

KNOW THE FRAME.
TRADE IN ALIGNMENT.

01
The Critical Range

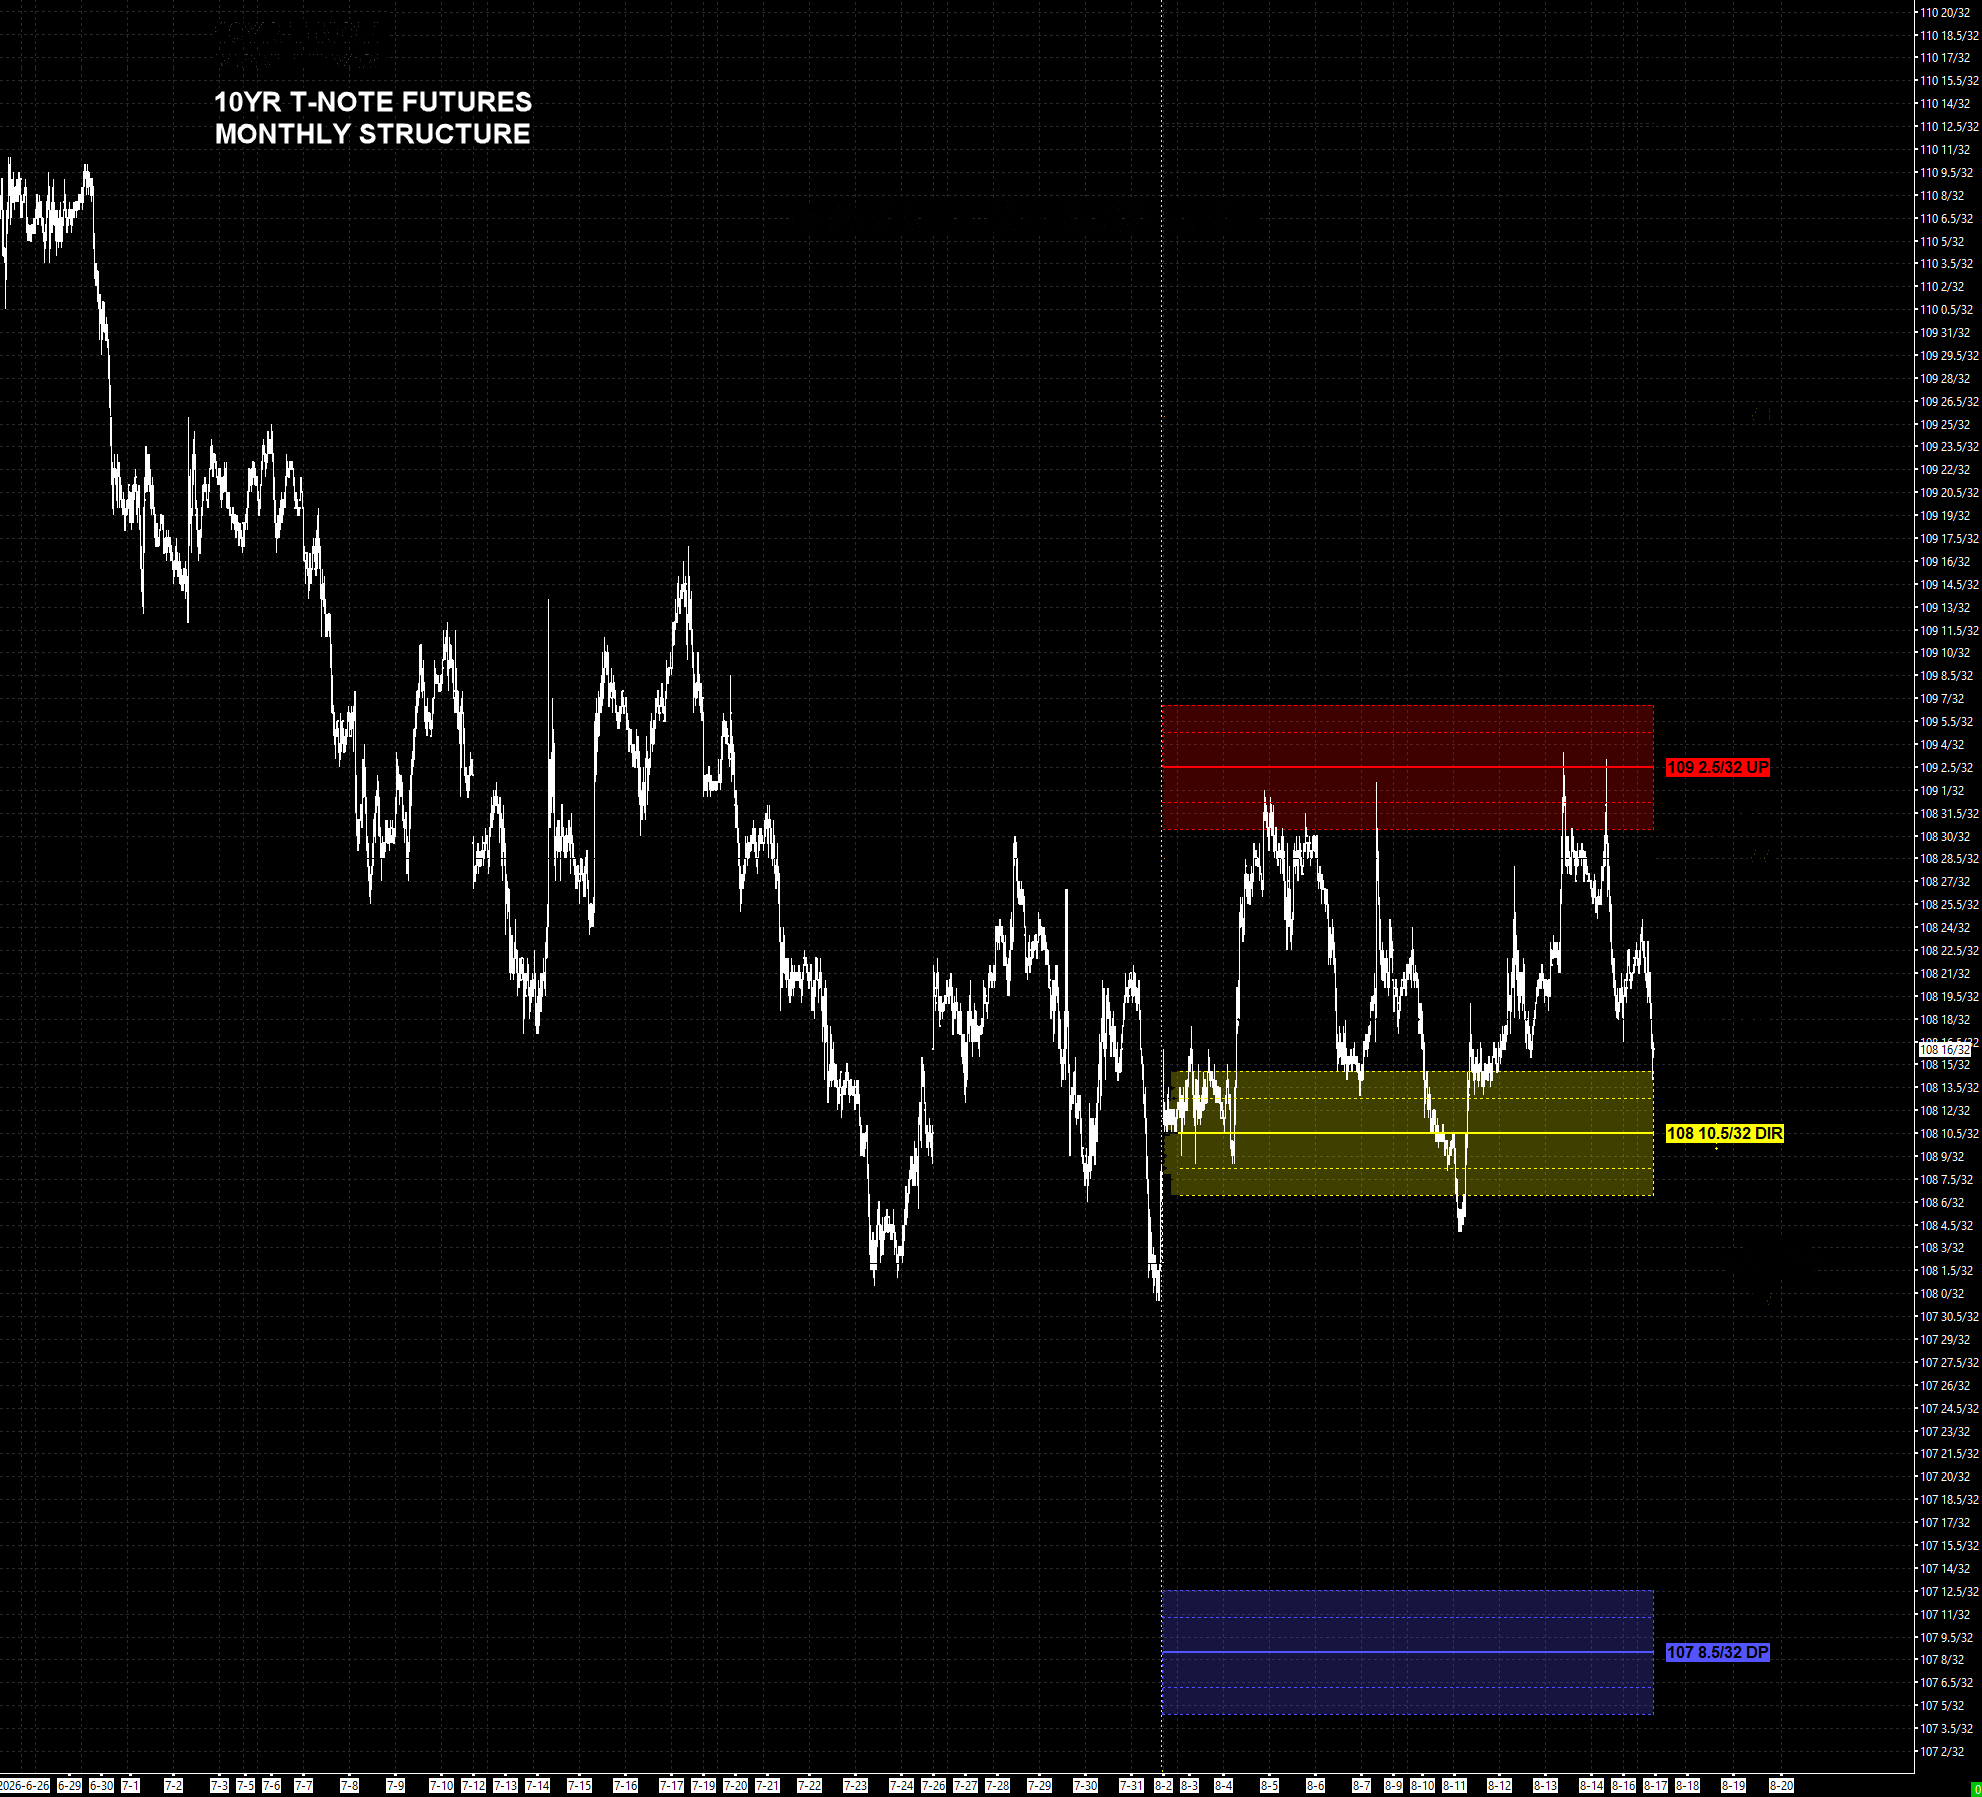
The Critical Range defines the market’s primary decision area for the period.

Why you need it: It gives you an objective frame for judging where price is, where decisions matter, and whether your trade idea is aligned with the market’s structure.

10-Year T-Note monthly chart showing the Critical Range - Upside Pivot in red, Directional in yellow, Downside Pivot in blue
The Critical Range — UP · DIR · DP.
02
The Sentiment Bias

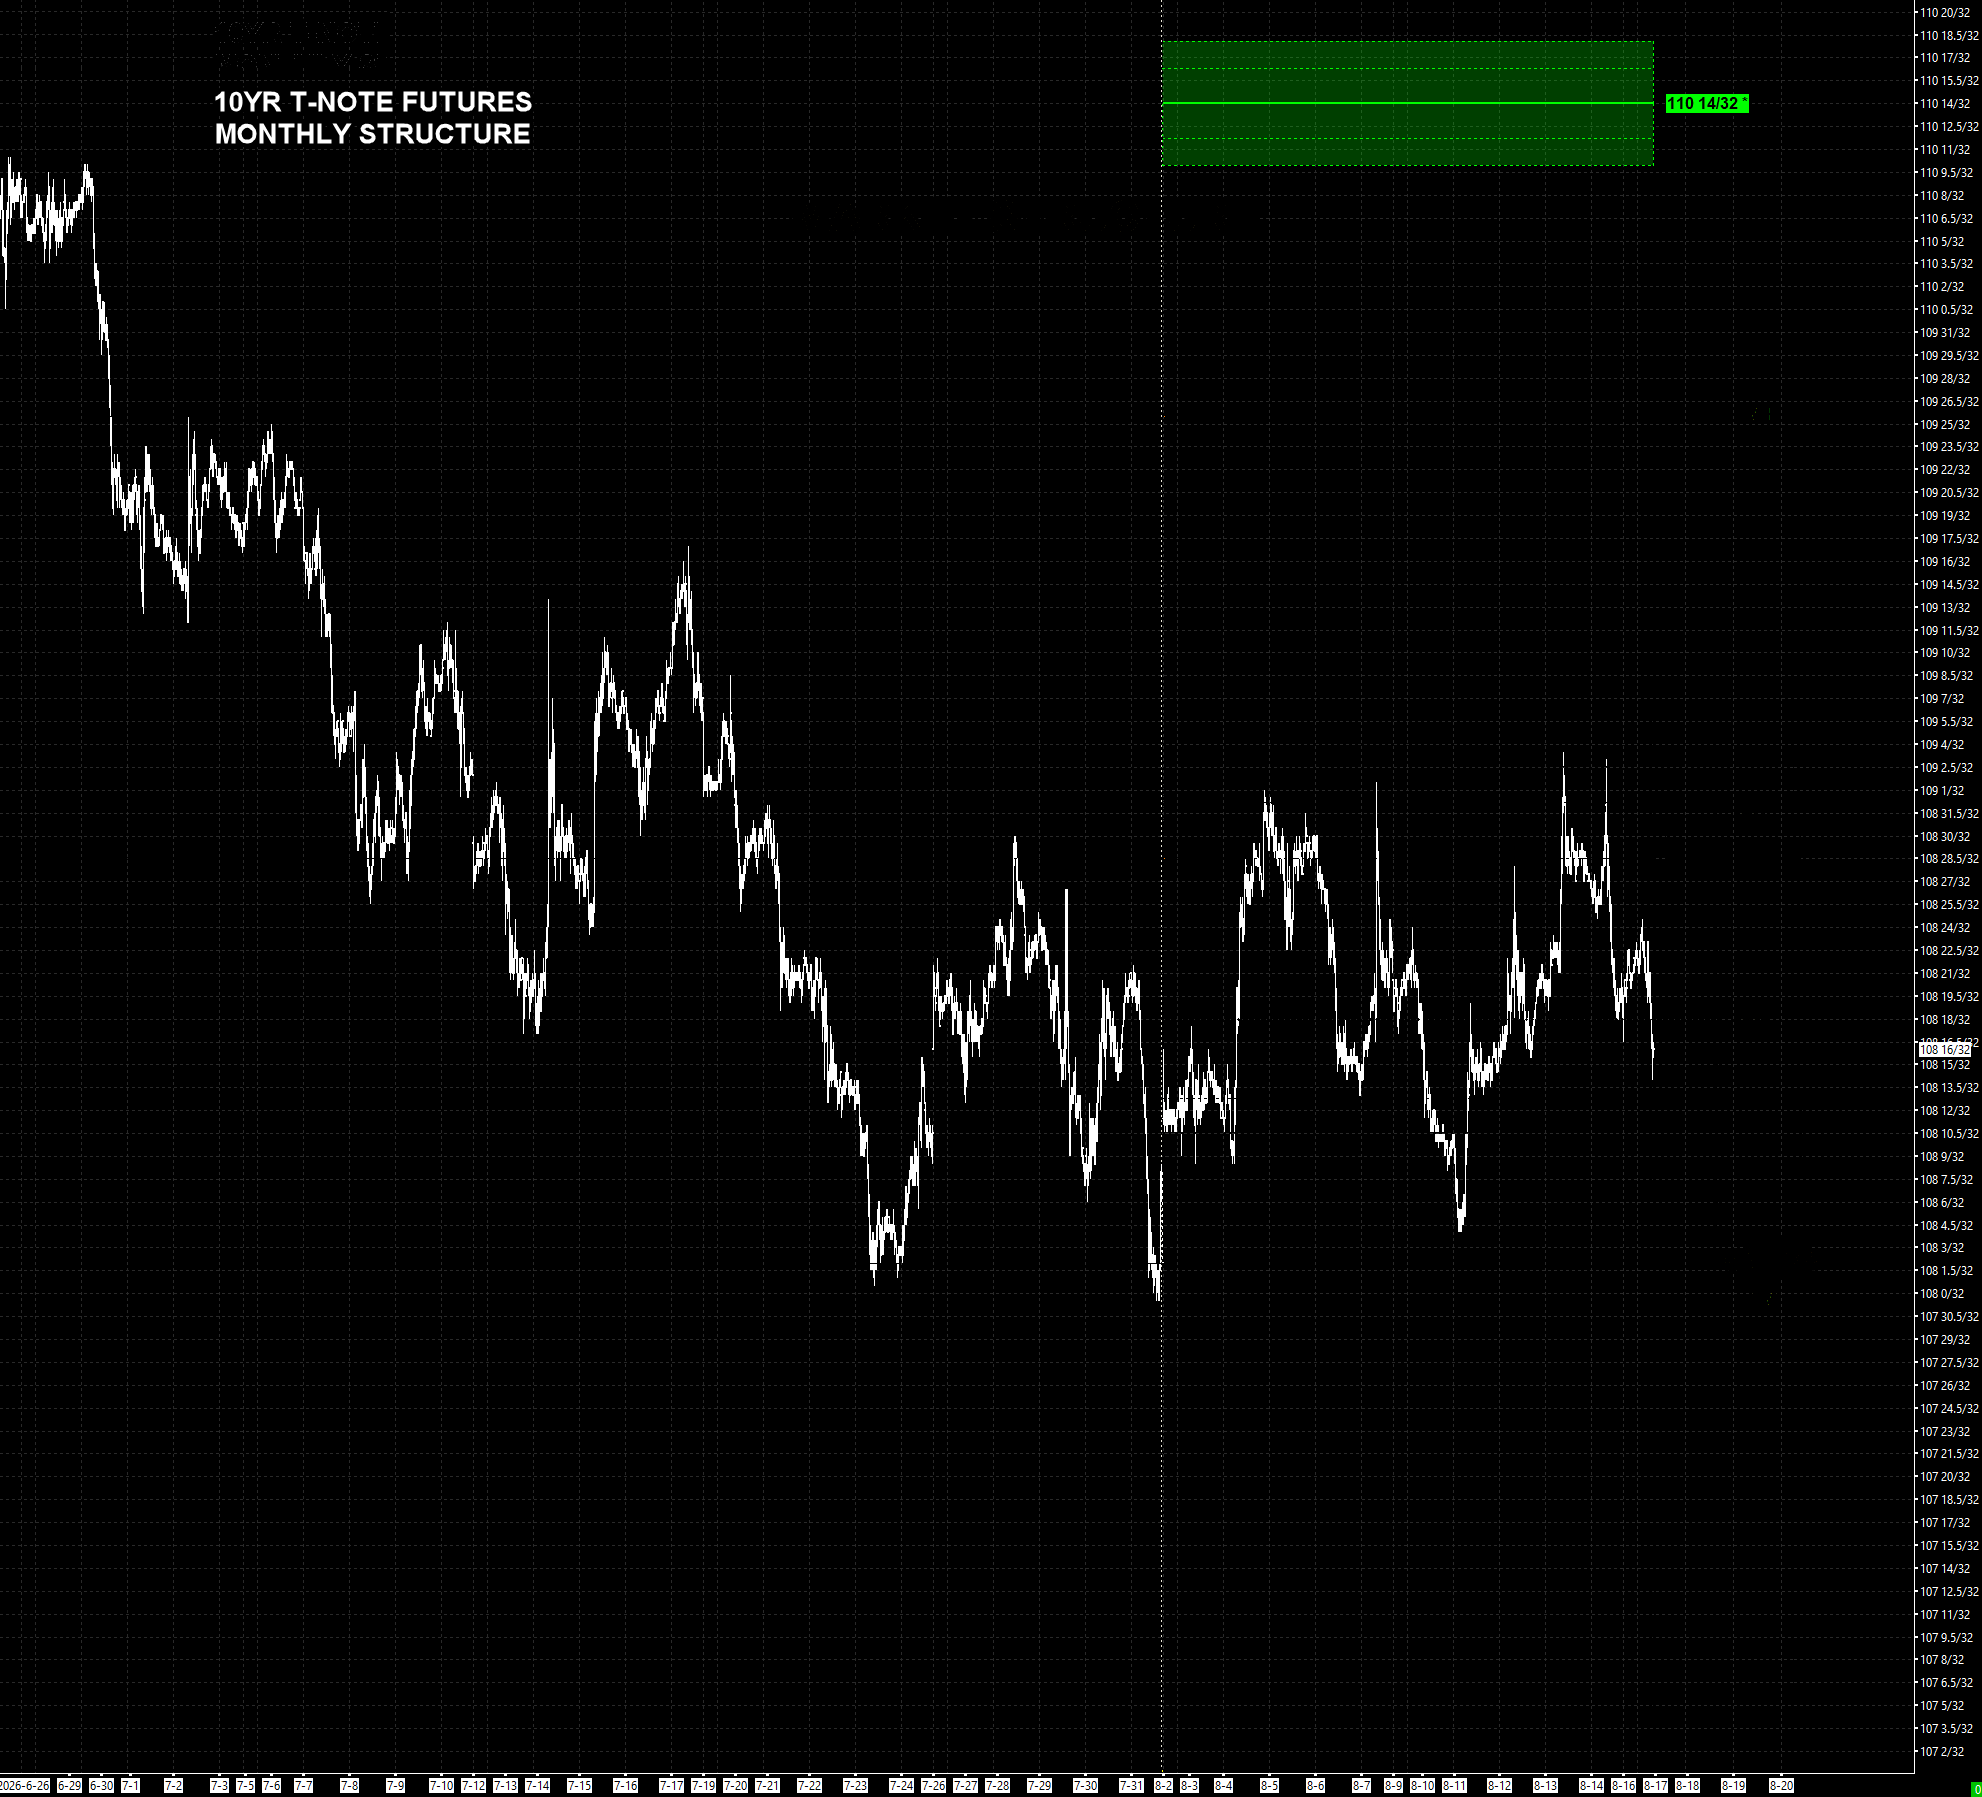
The R Level defines the market’s Sentiment Bias for the period, positive bias above, negative below.

Why you need it: The same market state can mean trend or correction depending on where sentiment sits. It tells you whether to press a position or protect it.

10-Year T-Note monthly structure showing the R sentiment bias level in green, above the Critical Range
The same note — R alone, sitting above the range.
Chart Overlay Delivery

DELIVERED TO
YOUR CHARTS.

Structure should appear where decisions are made.

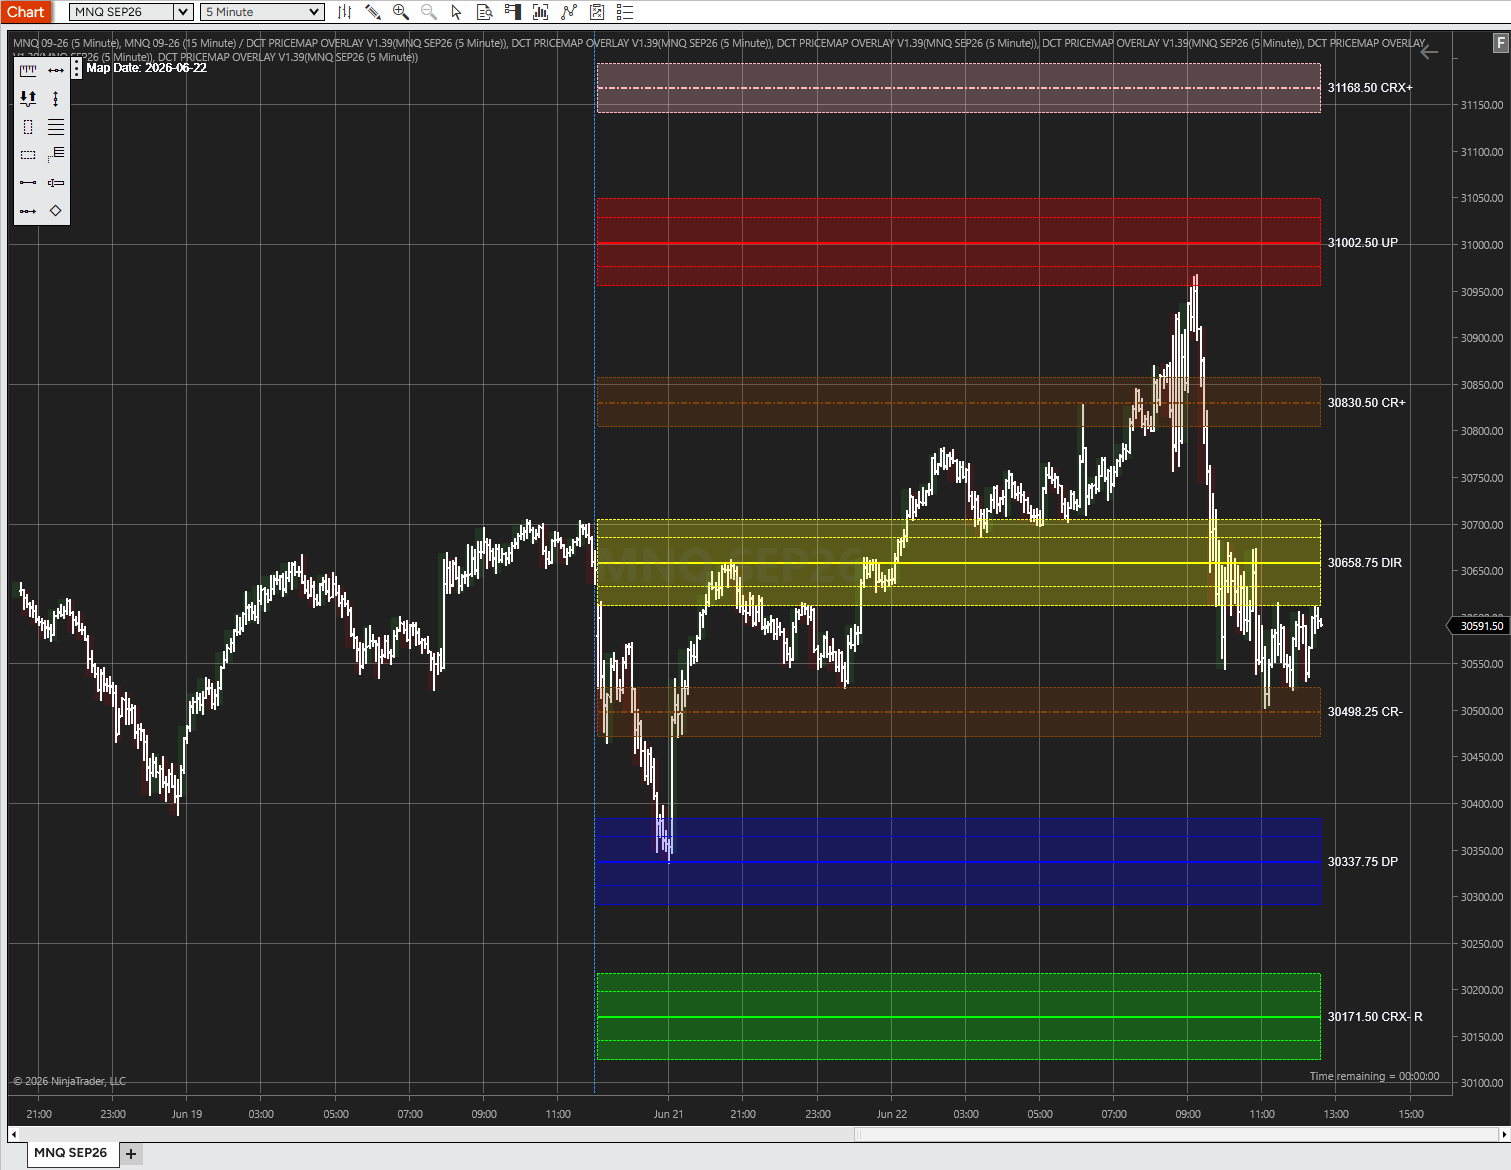
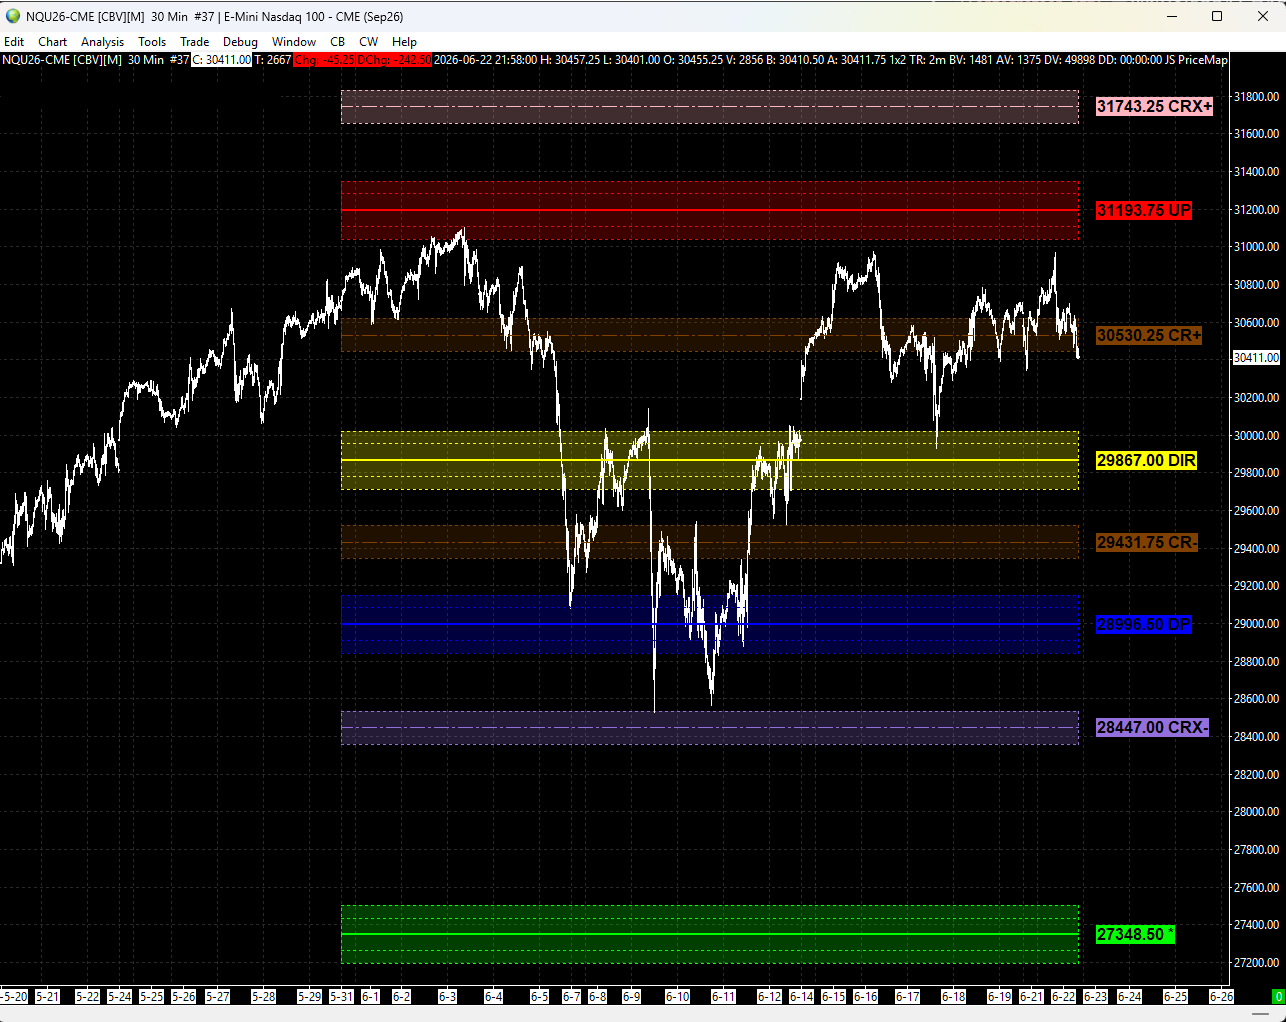
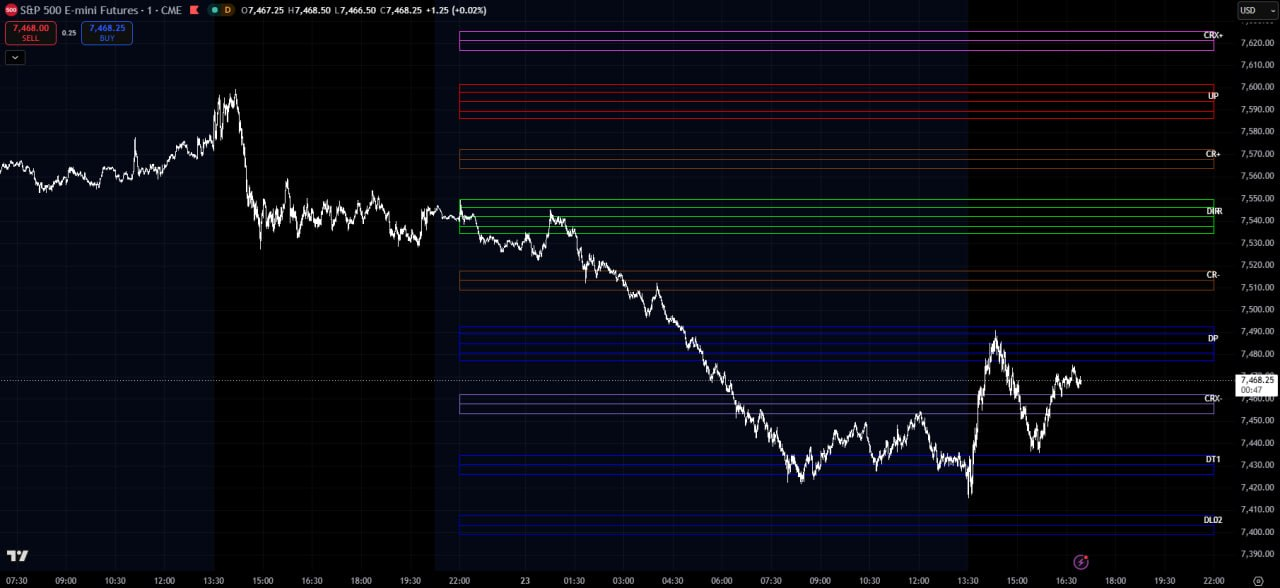
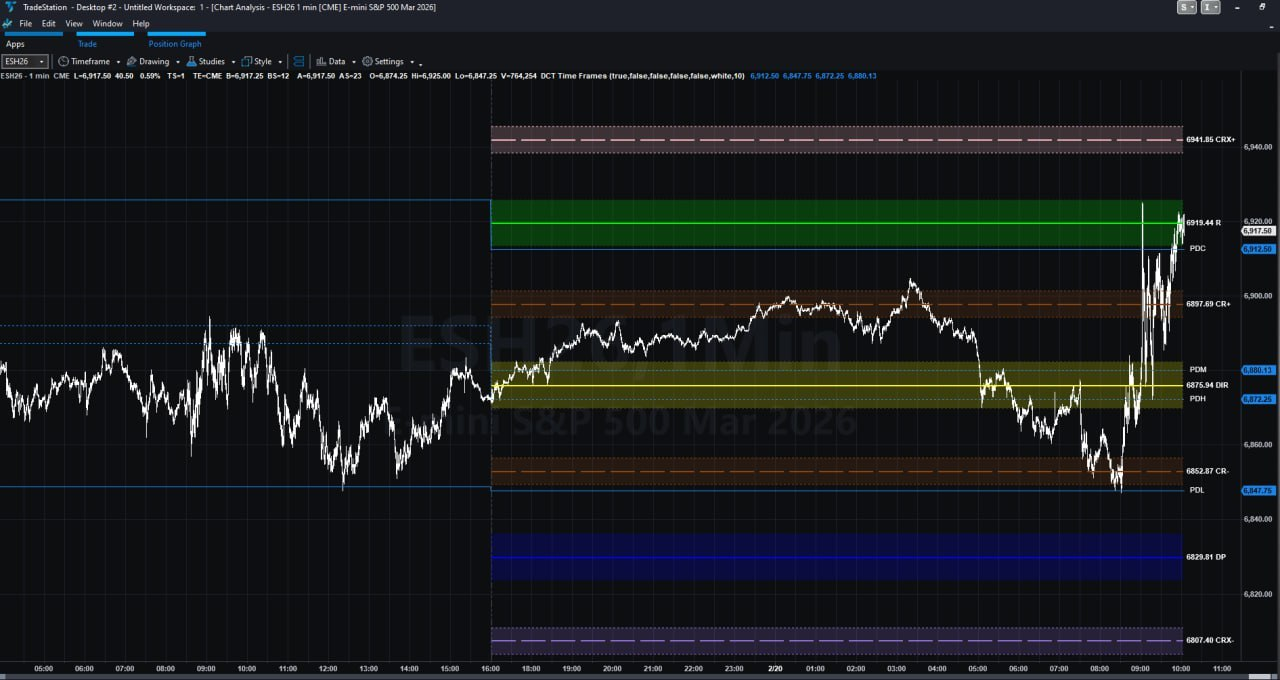
PriceMap is delivered directly to the charting environments traders already use. Connect once with an API key and the framework renders as a chart overlay or custom study. No workflow change required.

NINJATRADER SIERRA CHART TRADINGVIEW TRADESTATION BOOKMAP
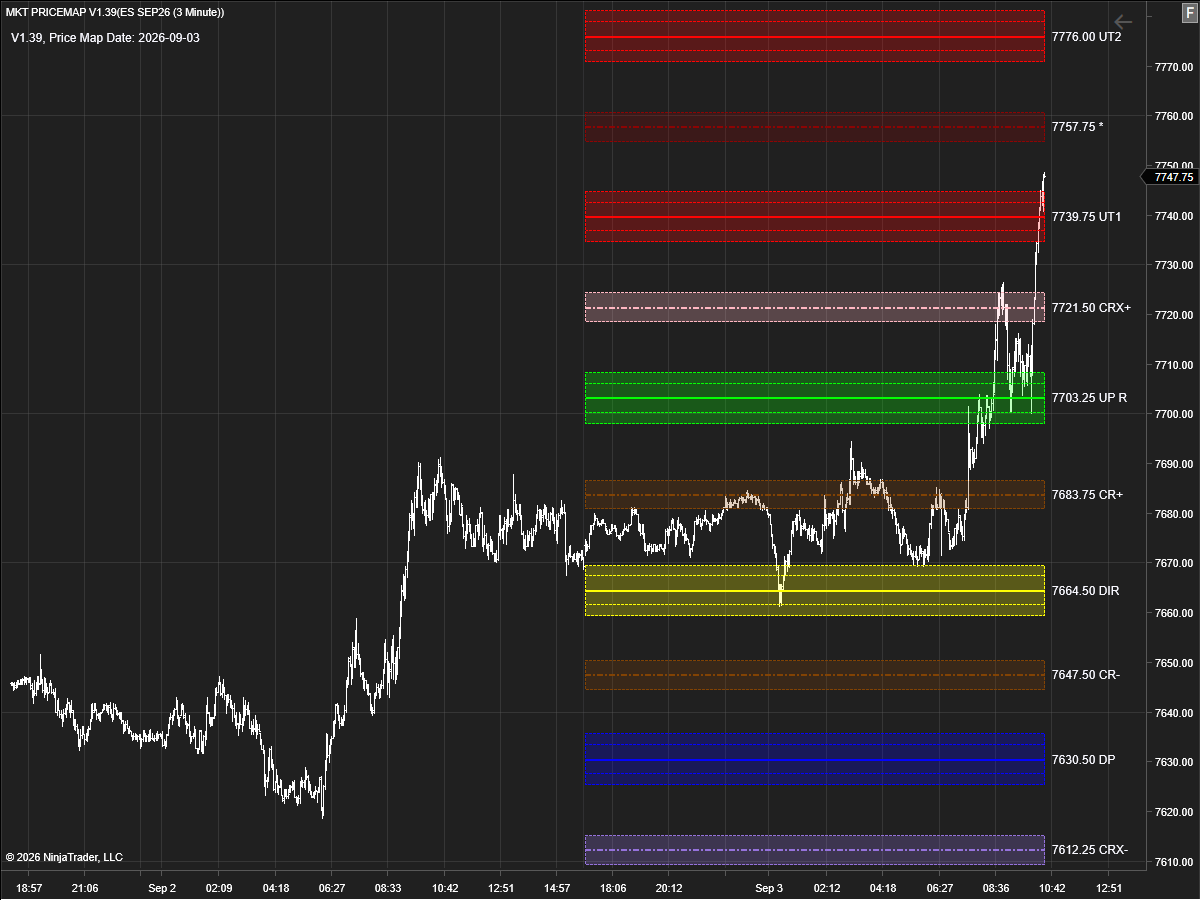
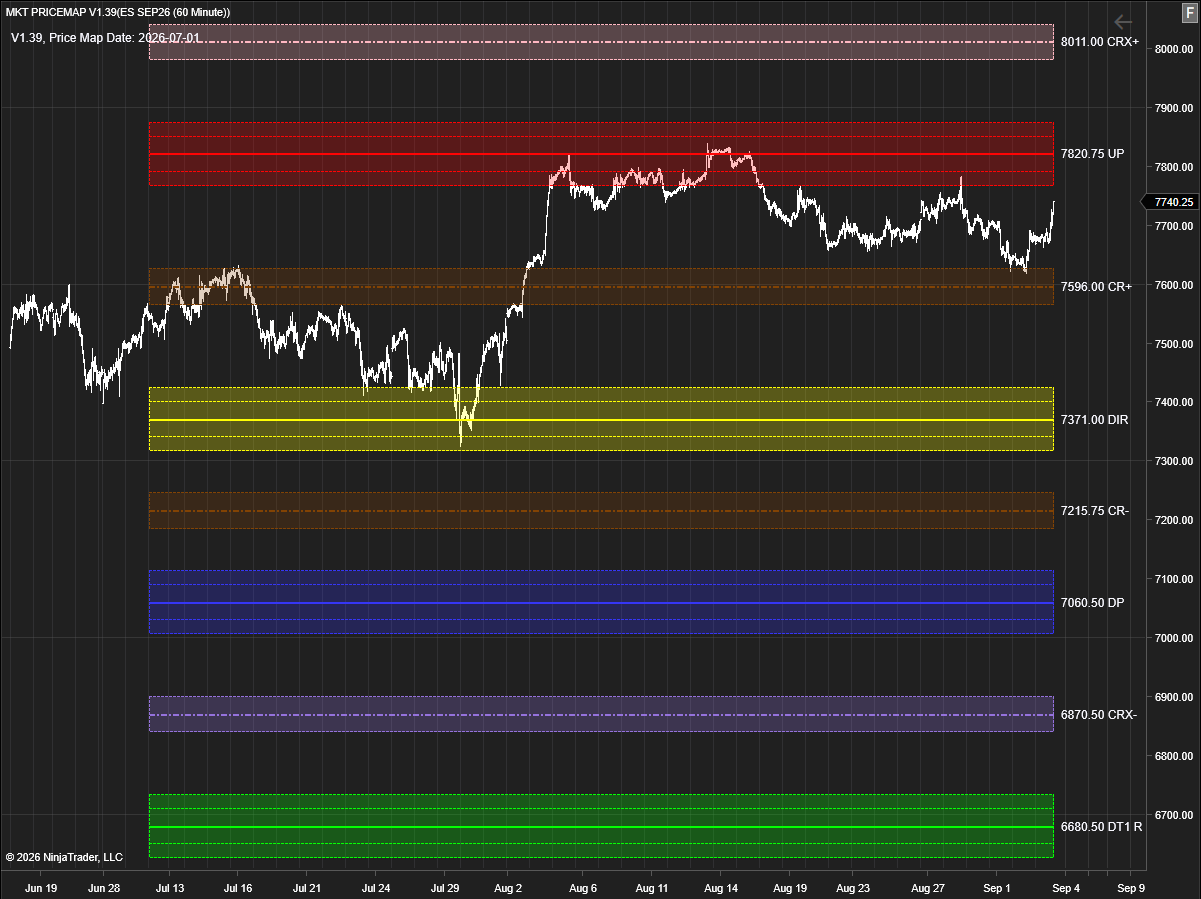
PriceMap levels overlaid on a NinjaTrader chart
NinjaTrader — overlaid on intraday and historical charts. Setup →
PriceMap levels overlaid on a Sierra Chart chart
Sierra Chart — installed as a custom chart study. Setup →
PriceMap levels overlaid on a TradingView chart
TradingView — through the Cloud Levels indicator. Setup →
PriceMap levels overlaid on a TradeStation chart
TradeStation — PriceMap as a custom chart study. Setup →
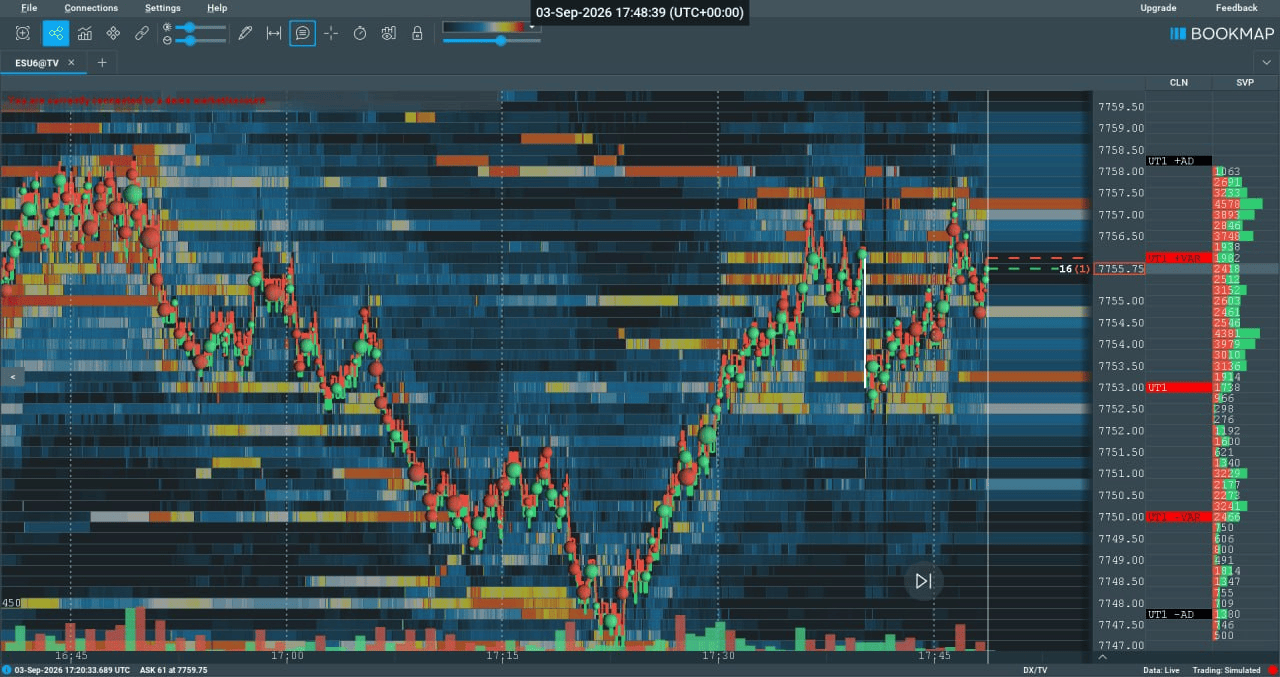
PriceMap levels shown as an independent notes column beside the Bookmap order-flow heatmap on ES
Bookmap — PriceMap as an independent notes column beside the order flow. Setup guide coming soon.

Five chart integrations available today, plus Auro Digital for institutional desks. See every integration and its setup guide →

Right Now

THE SAME FRAMEWORK.
EVERY TIMEFRAME.

One instrument, four periods. The same named levels, the same colours, the same read.

ES · Daily
ES futures daily PriceMap - the full set of named structural levels
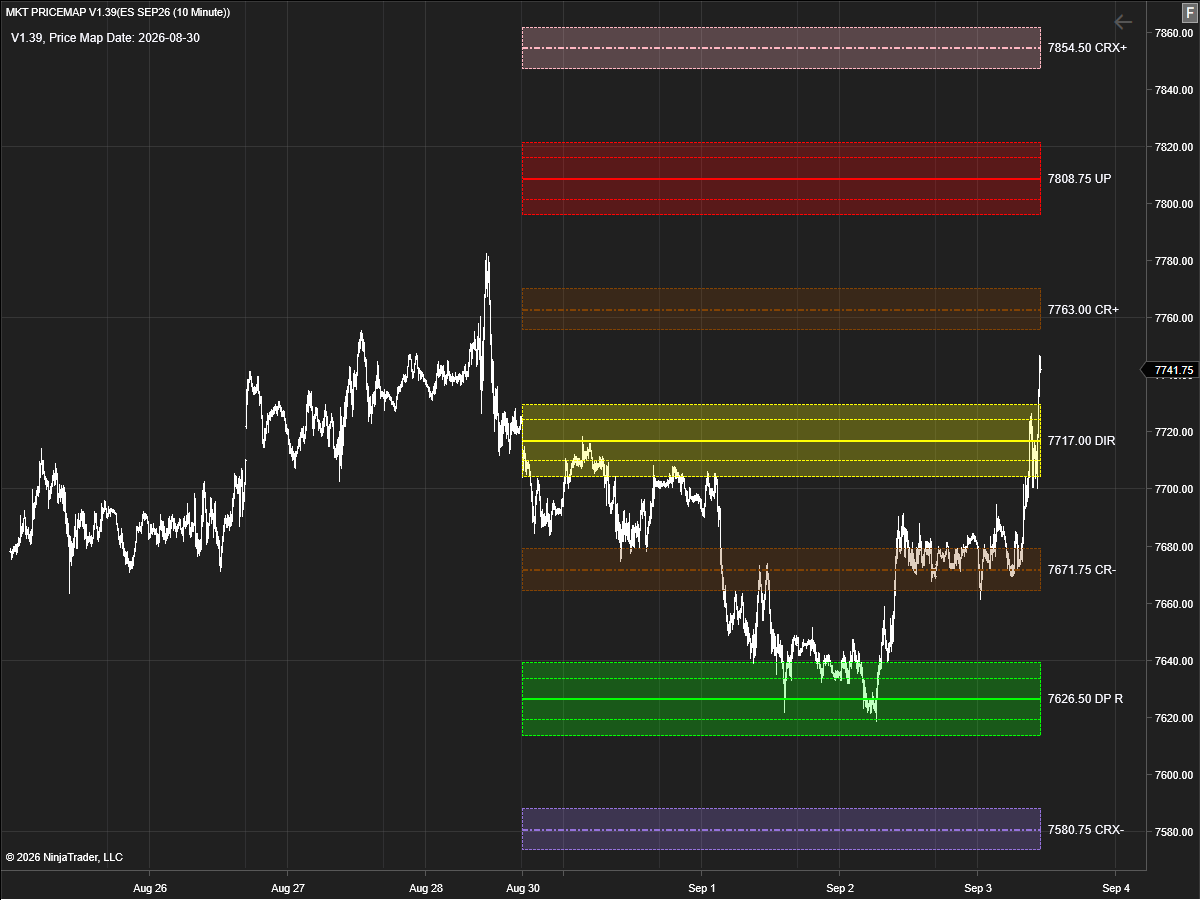
ES · Weekly
ES futures weekly PriceMap - the same named structural levels on the weekly period
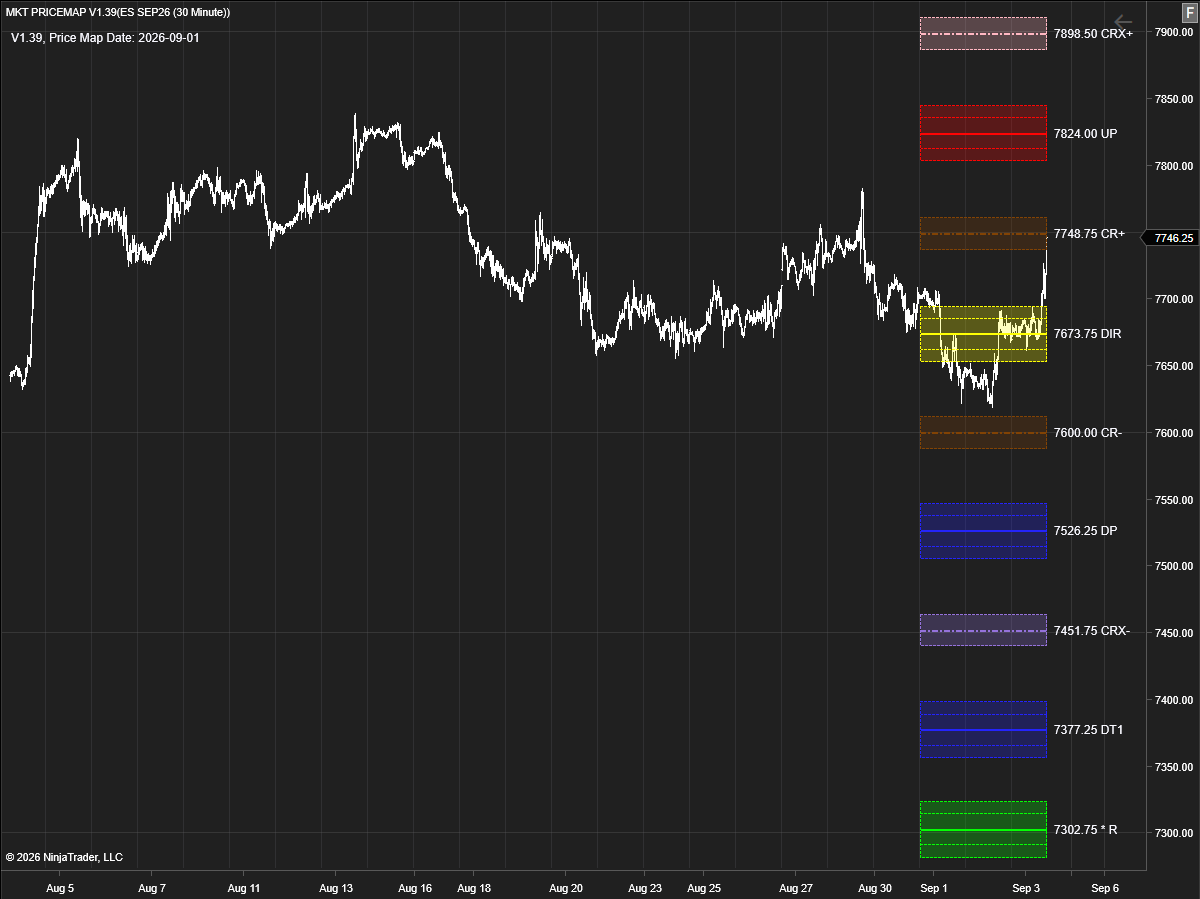
ES · Monthly
ES futures monthly PriceMap - the same named structural levels on the monthly period
ES · Quarterly
ES futures quarterly PriceMap - the same named structural levels on the quarterly period
Learn it once.

The same named levels, the same colours, the same read — on every period, and across 500+ markets: futures, stocks, ETFs, crypto, forex and cash indices.

See the markets covered →
Who PriceMap Serves

BUILT FOR
OPERATORS.

One framework, six desks. The structure does not change — the timeframe and the decision it informs do.

See how PriceMap fits your desk →

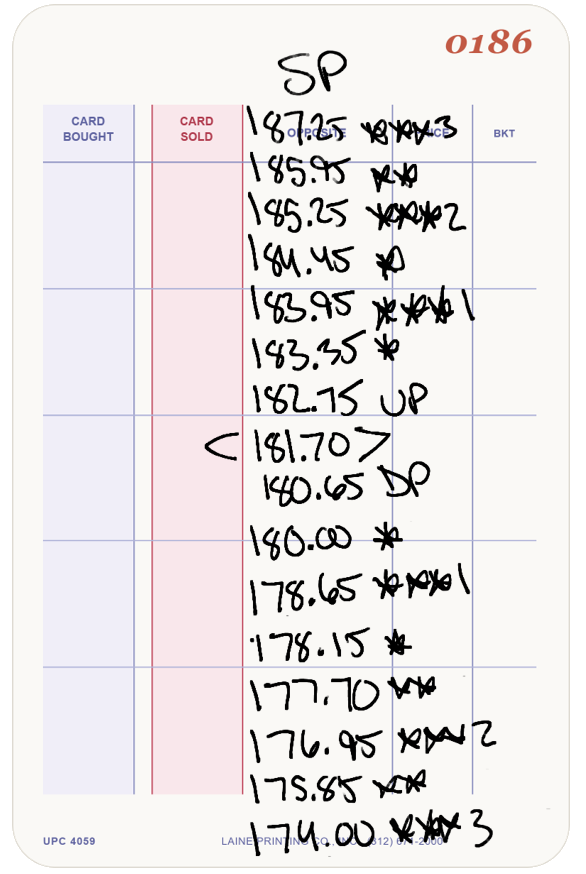
Handwritten index card with market levels prepared for an S&P trader.
Handwritten market levels for an S&P trader—the practical beginning of the work behind PRICEMAP.

WHERE THIS CAME FROM

IT STARTED WITH A CARD

PRICEMAP began with a simple floor-trading need: give traders the important market levels before the trading day began.

Early in my career, I reconciled positions and did technical work for a local S&P trader. I wrote the market levels that mattered on a card and handed it to him before trading began.

Other traders started asking for copies. One card became several. That practical routine became the foundation of JS Services Trading and Research LLC and the analytics that ultimately evolved into MKT.TRADE.

The tools and delivery have changed, but the problem has not. Price is always visible. Structure is not. An operator still needs an objective map of where price is operating, which boundaries matter, and where the current condition can begin to change.

PRICEMAP is the modern expression of that original need. It defines objective market structure through one consistent framework, unified across markets, asset classes, and Daily, Weekly, Monthly, Quarterly, and Yearly time frames. The card was only the beginning. The work evolved, but the purpose remained the same: define the structure first, then make the decision.

The format changed. The need for objective structure did not.
Access

START WITH
STRUCTURE.

PriceMap is available as a chart overlay subscription and as part of the full Navigator engine. Day Trader and Pro Trader start with two weeks free — cancel inside the trial, owe nothing.

mkt.trade · info@mkt.trade

PriceMap defines where markets make decisions. The next layer defines what kind of environment those decisions are being made in.

Next · Layer 02
State Analytics
26 signature market states. 9 Regime skews. The 4K HD of market context.
→