Bitcoin: What’s Next?
Before we read Bitcoin, here is the framework the read is built on: the Fact Foundation, the Time Frame, the Time Phase, and the PriceMap. If you already run it, skip ahead to The Read.
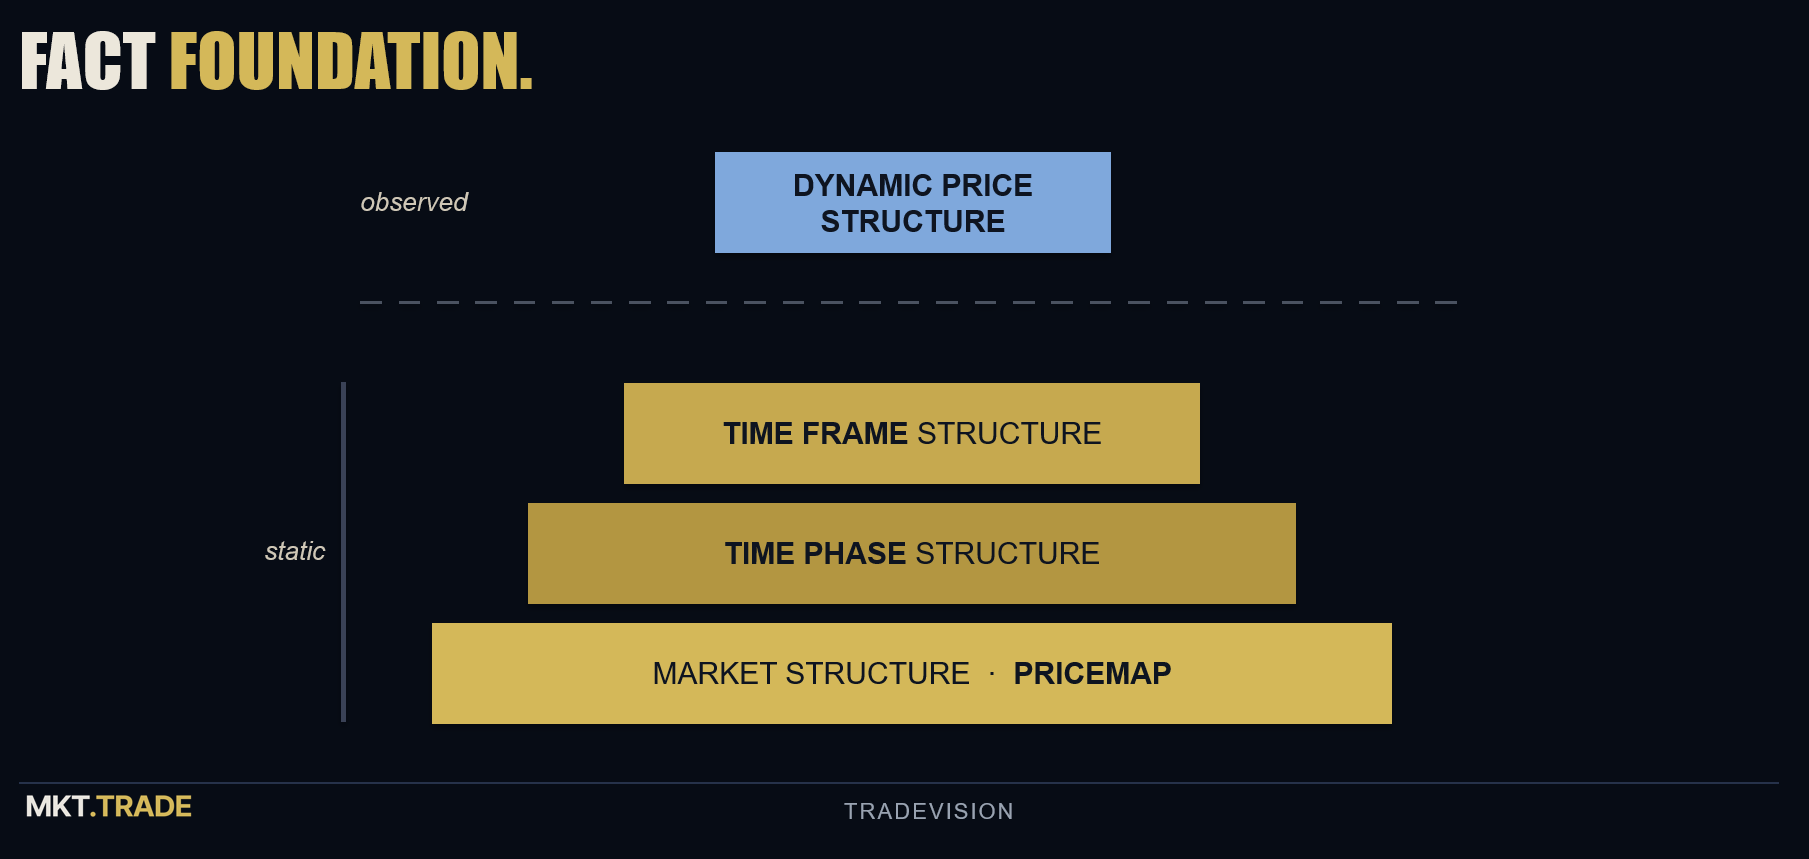
Most subjective bias comes from what we are observing in price action — the story we tell ourselves about the move. The fact foundation is the opposite: an objective truth that is set before the period trades a tick. It has three layers — Time Frame structure, Time Phase structure, and the base foundation, Market Structure (the PriceMap). The base supersedes everything above it, and your trade decisions need to be in alignment with that base.
It is a mindset shift. Reading price alone, it’s “I think this happens next.” Working from the facts, it’s “this is what’s true — now, do I trade with it or not.” The truth isn’t the question. Your decision is. That is where real clarity comes from.
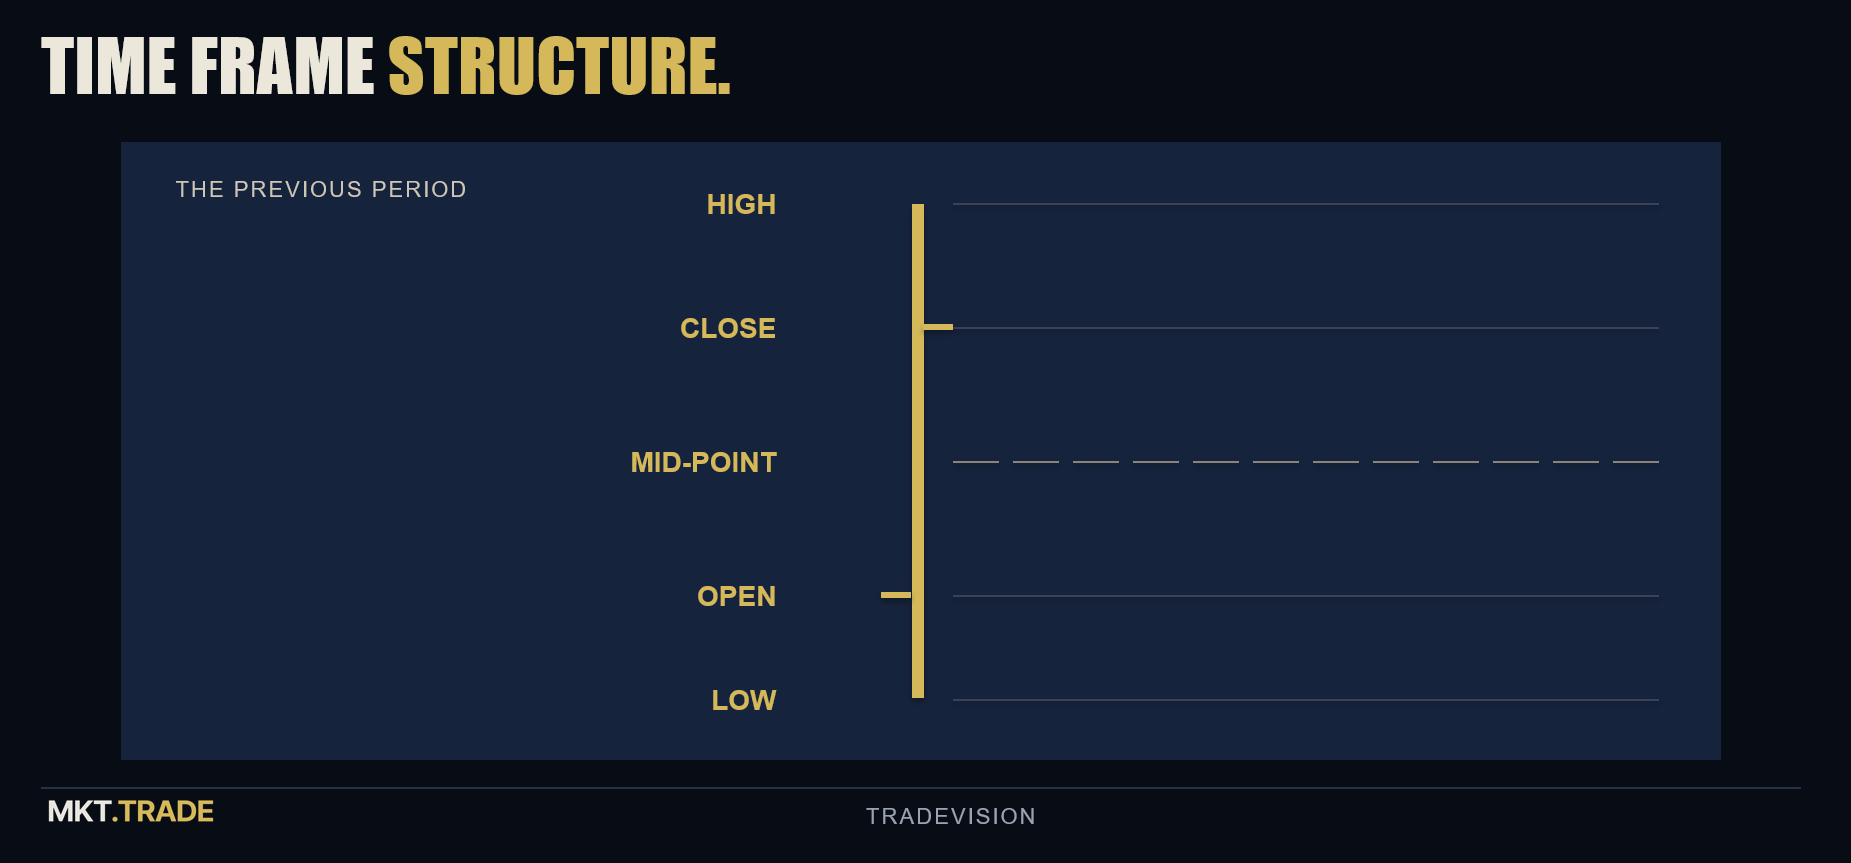
We are reading the Monthly throughout this piece, so the Time Frame is last month’s footprint: the previous month’s high, low, close and midpoint (PMH / PML / PMC / PMM). It is the simplest fact on the board, and the benchmark every asset manager is measured against — how are we doing versus last month? Above the previous close is positive; above the midpoint is trending; below the midpoint is corrective. Static, public, known before the month opens.
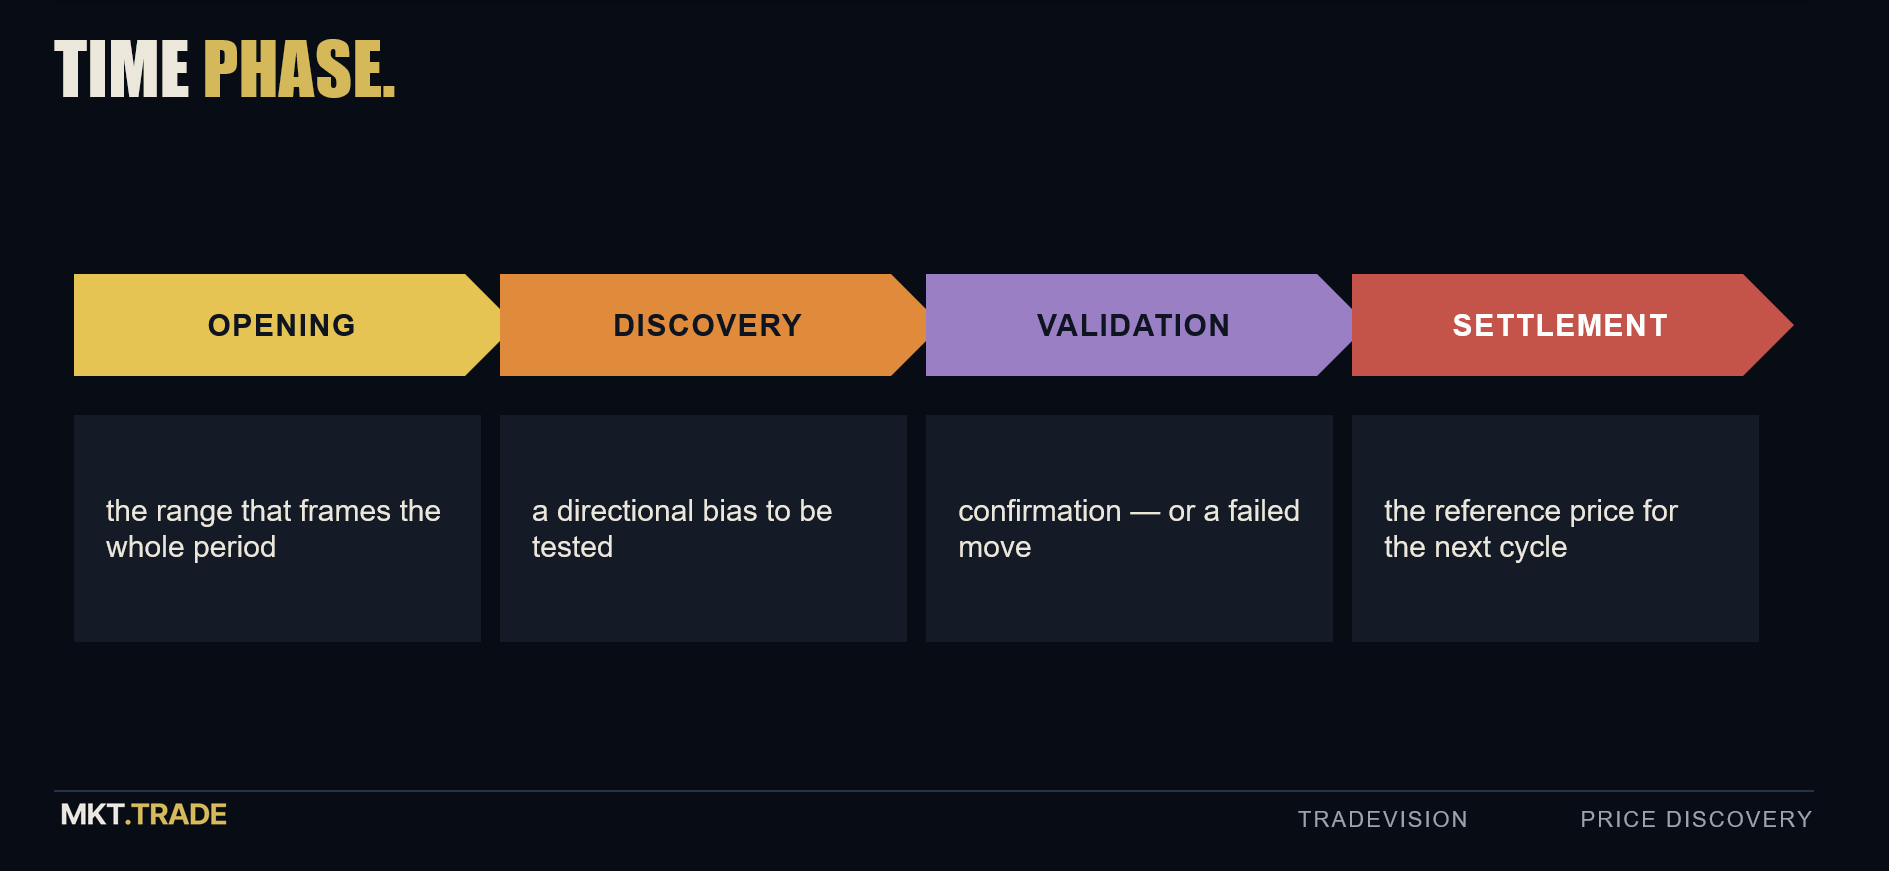
Where the Time Frame tells you the score, the Time Phase tells you how price is likely to behave right now. Every trade period moves through the same phases, each with its own character: an opening phase that finds equilibrium, a discovery phase that probes the opening range’s extremes, a validation phase where the market actually makes its move, and a settlement phase into period-end when funds rebalance and the tape turns wily. Read the phase and you know what kind of behavior to expect — and the opening range it sets stays valid the entire period.
The PriceMap is the base market structure — a set of data-driven, qualified levels that define what makes the current market state true. It is static: the levels do not change through the period. These are the inflection points that decide whether a state persists or breaks and transitions.
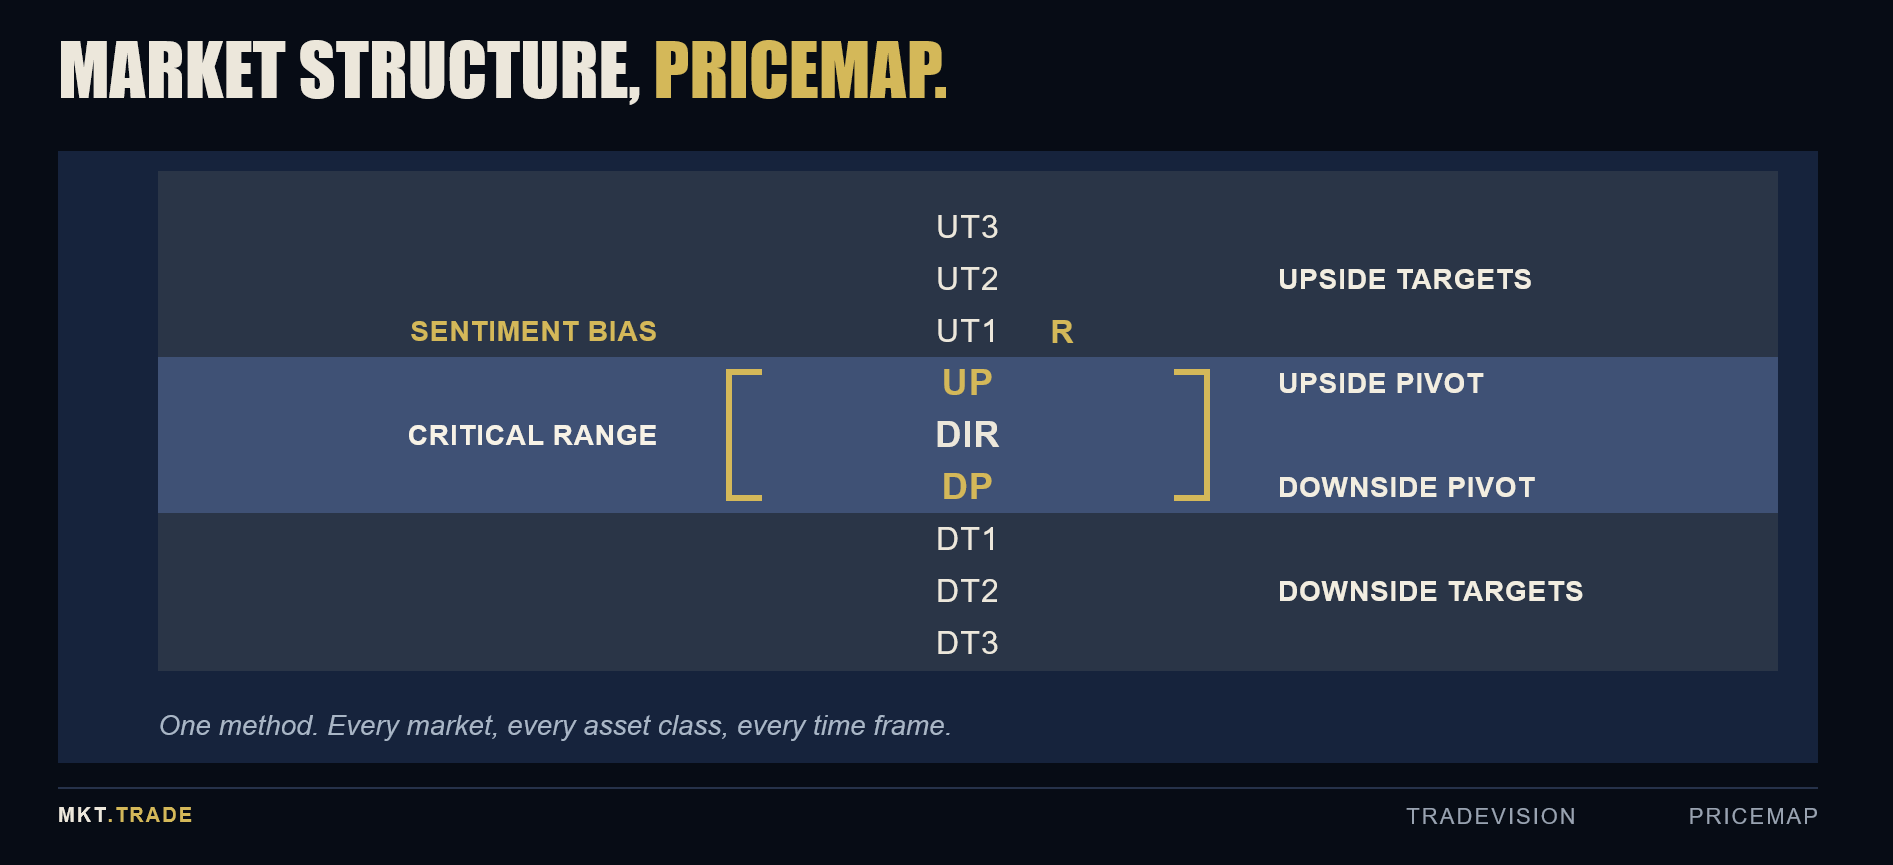
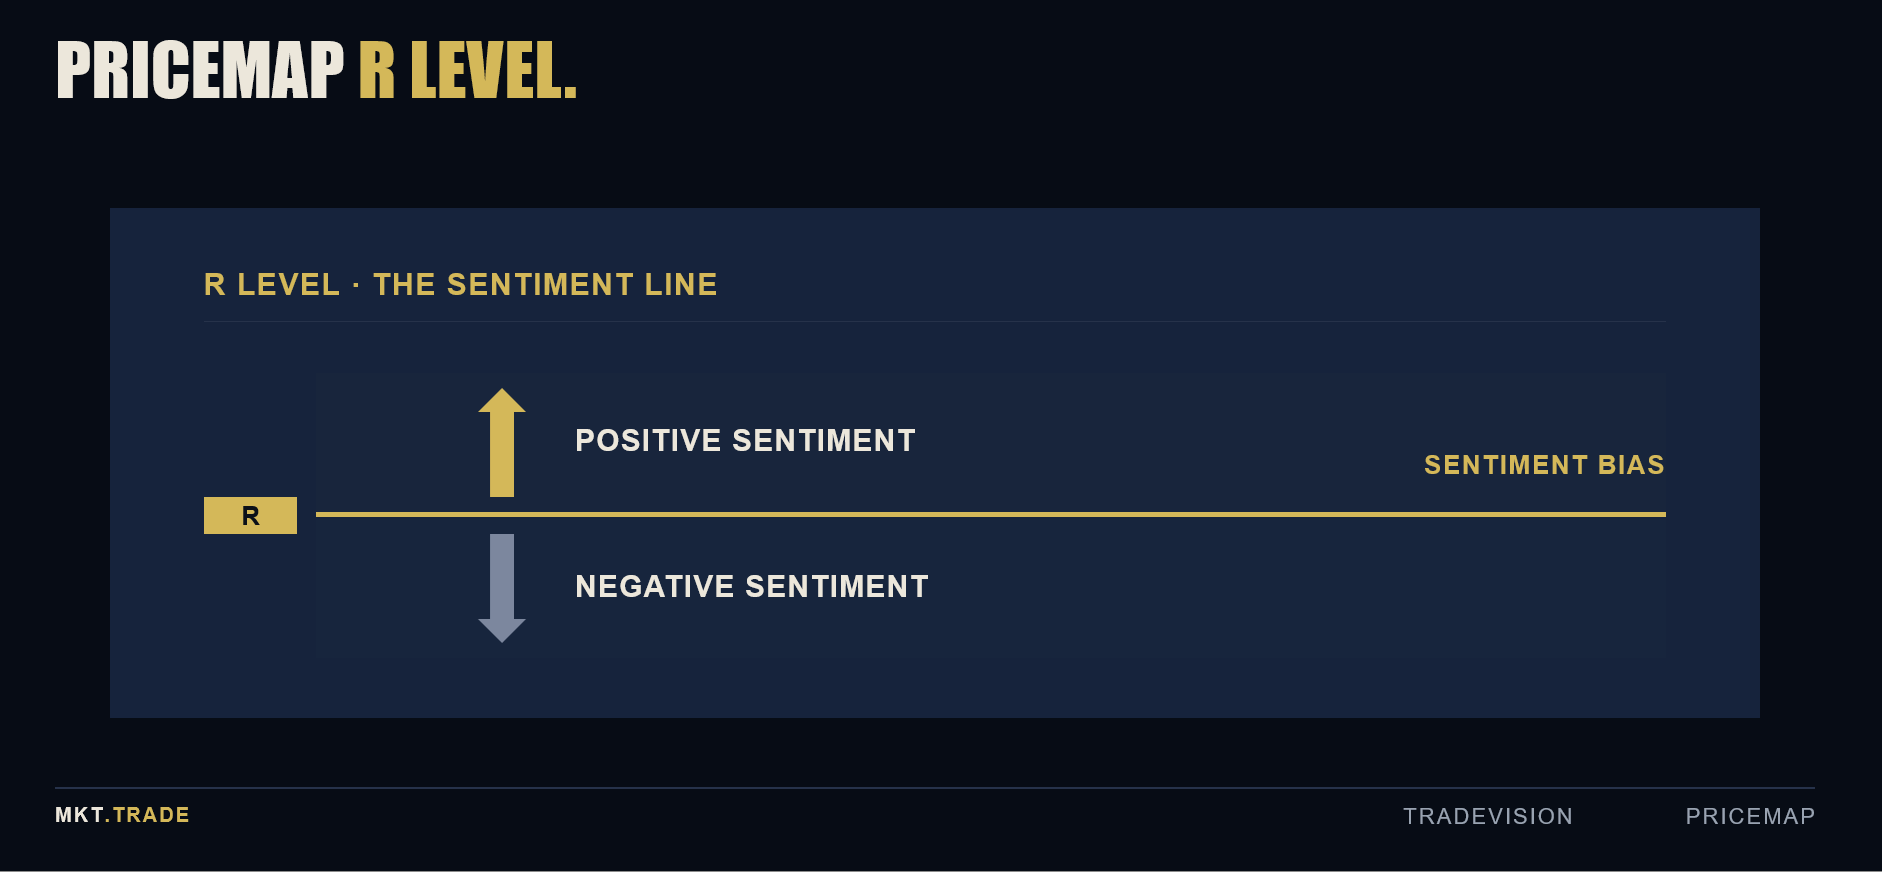
Two pieces are the foundation: the R Level — the sentiment bias, the over/under where the real energy sits; positive above it, negative below it — and the Critical Range, the zone of indecision, with the UP as resistance and the DP as support.
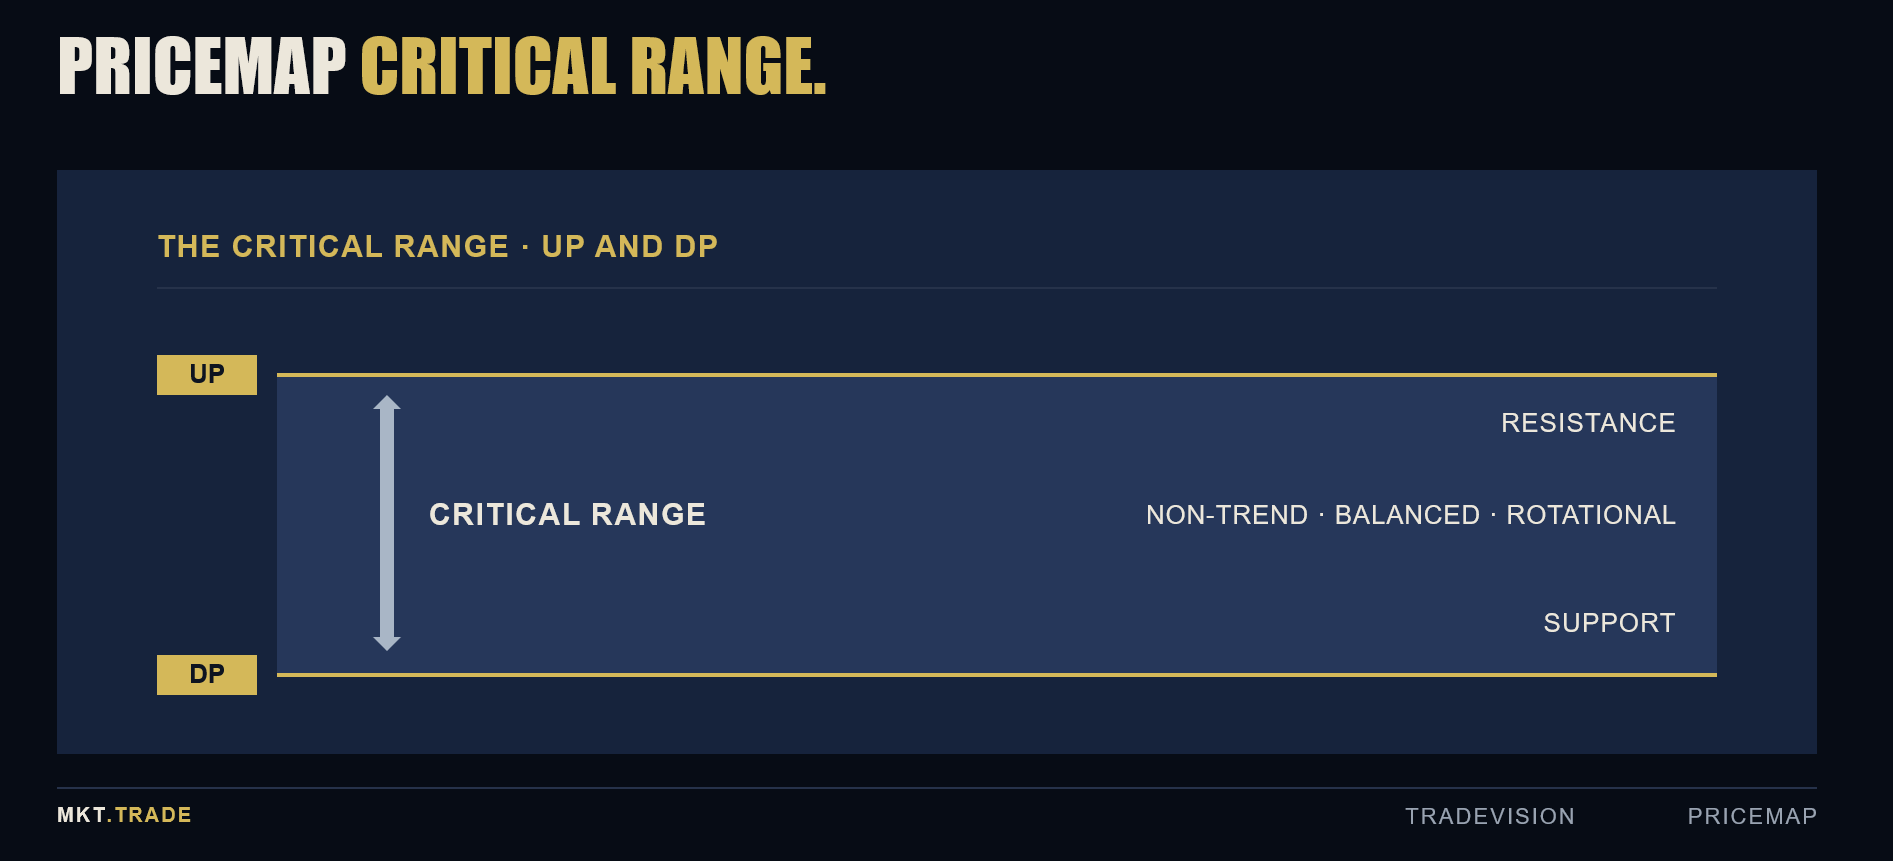
Inside the Critical Range, you fade the edges. Once price qualifies outside it, you go with the move. That is the whole read — is price agreeing with the structure, or not — and from here we just watch Bitcoin answer it, one step at a time.
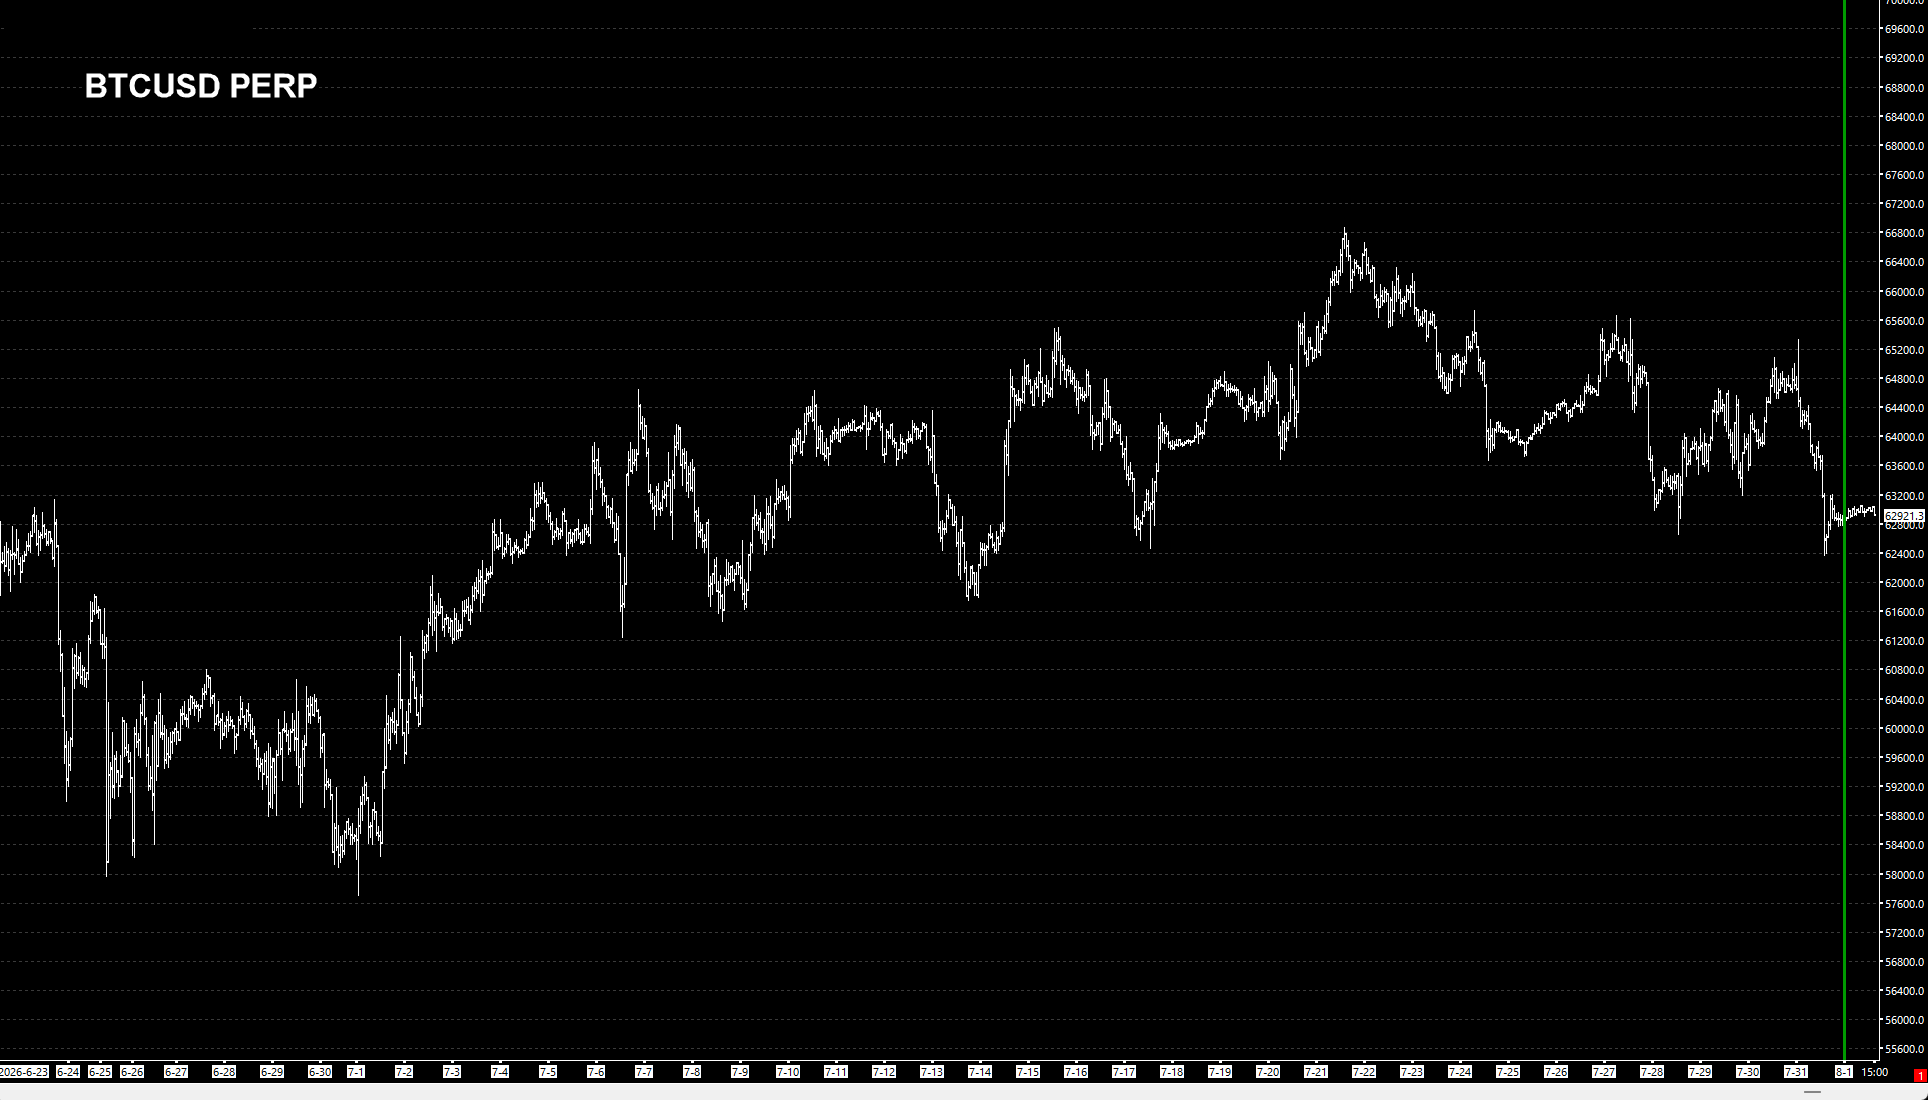
Before Bitcoin traded a tick in August, two things were already on the chart: raw price, and last month’s footprint — the PMH, PML, PMC and PMM. Public, and fixed before the month opened.
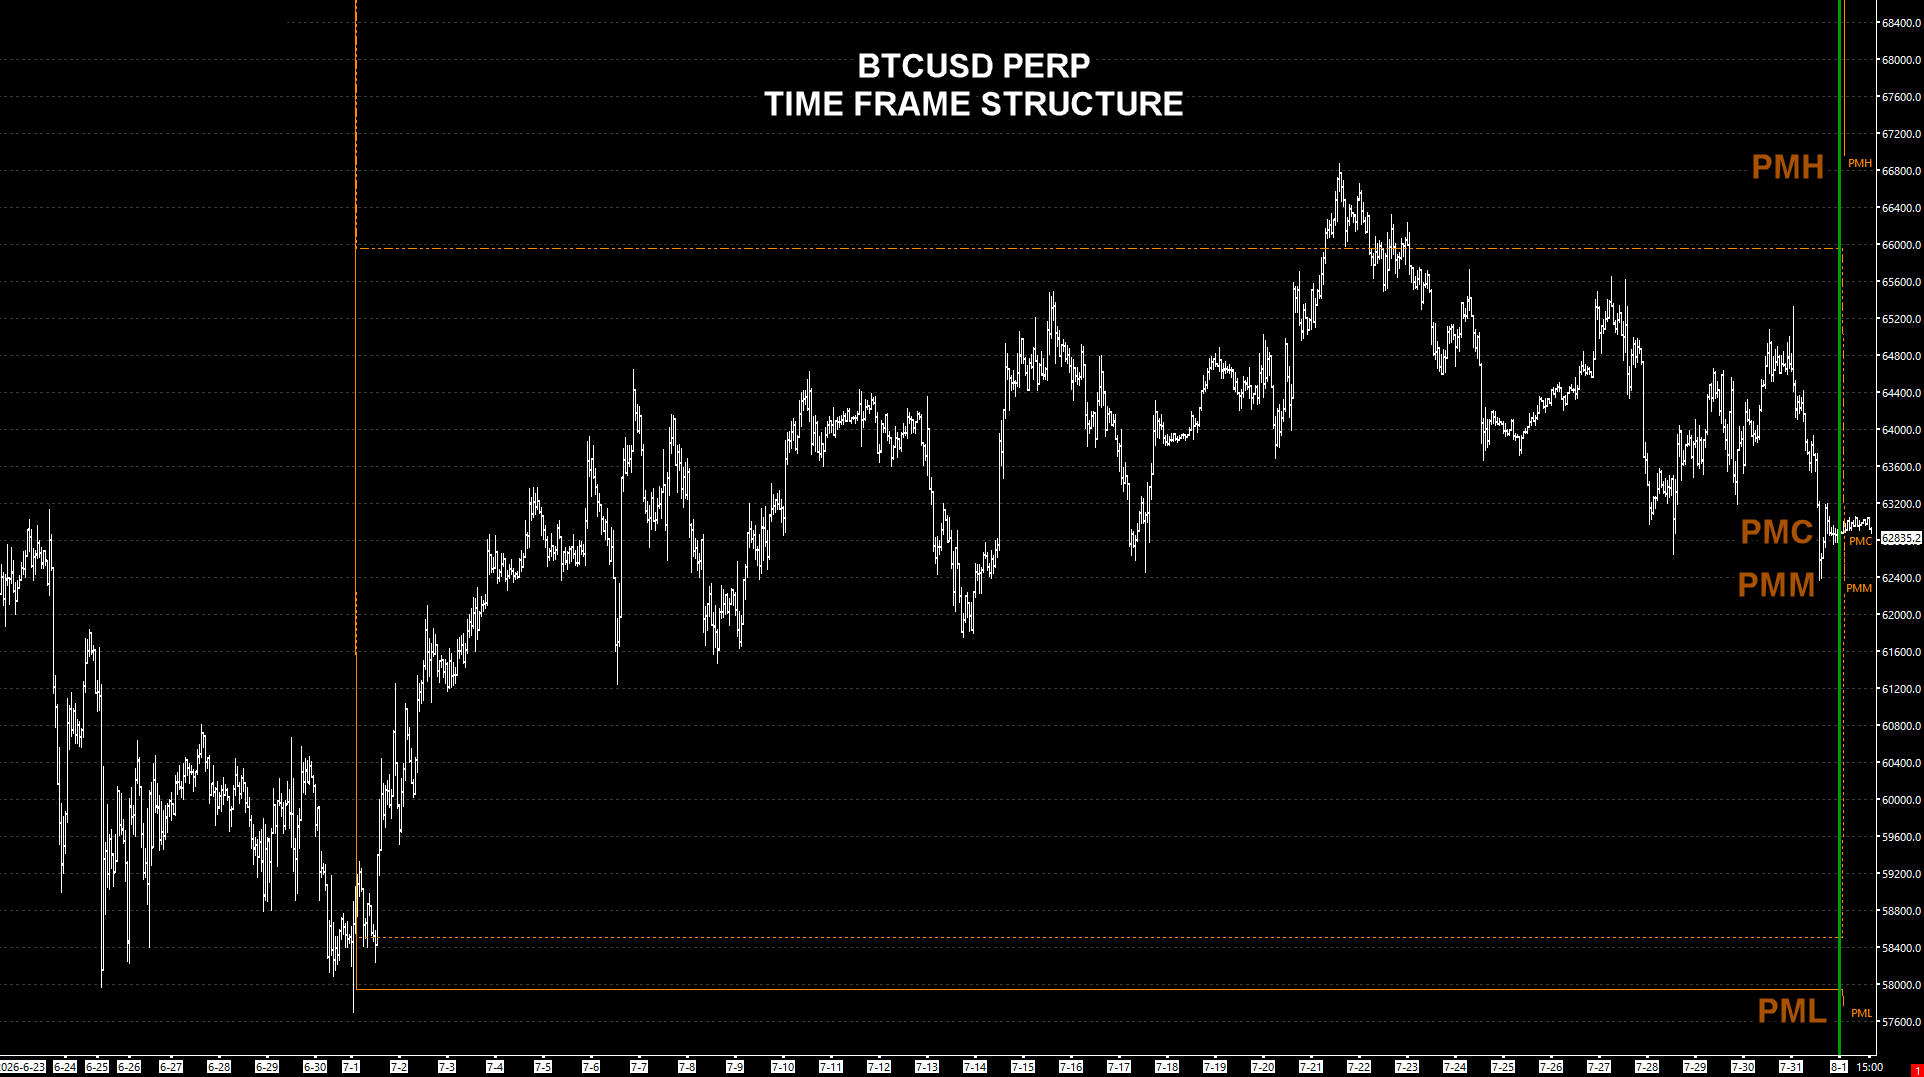
Here is what the Time Frame tells us. The PMC and PMM printed tight together, and that closeness is the tell: it forms a momentum band inside the wider PMH–PML range. Above that band the market leans higher, targeting the PMH; below it, lower, targeting the PML. Price opened holding above the band — a positive lean, before a single PriceMap level is added.
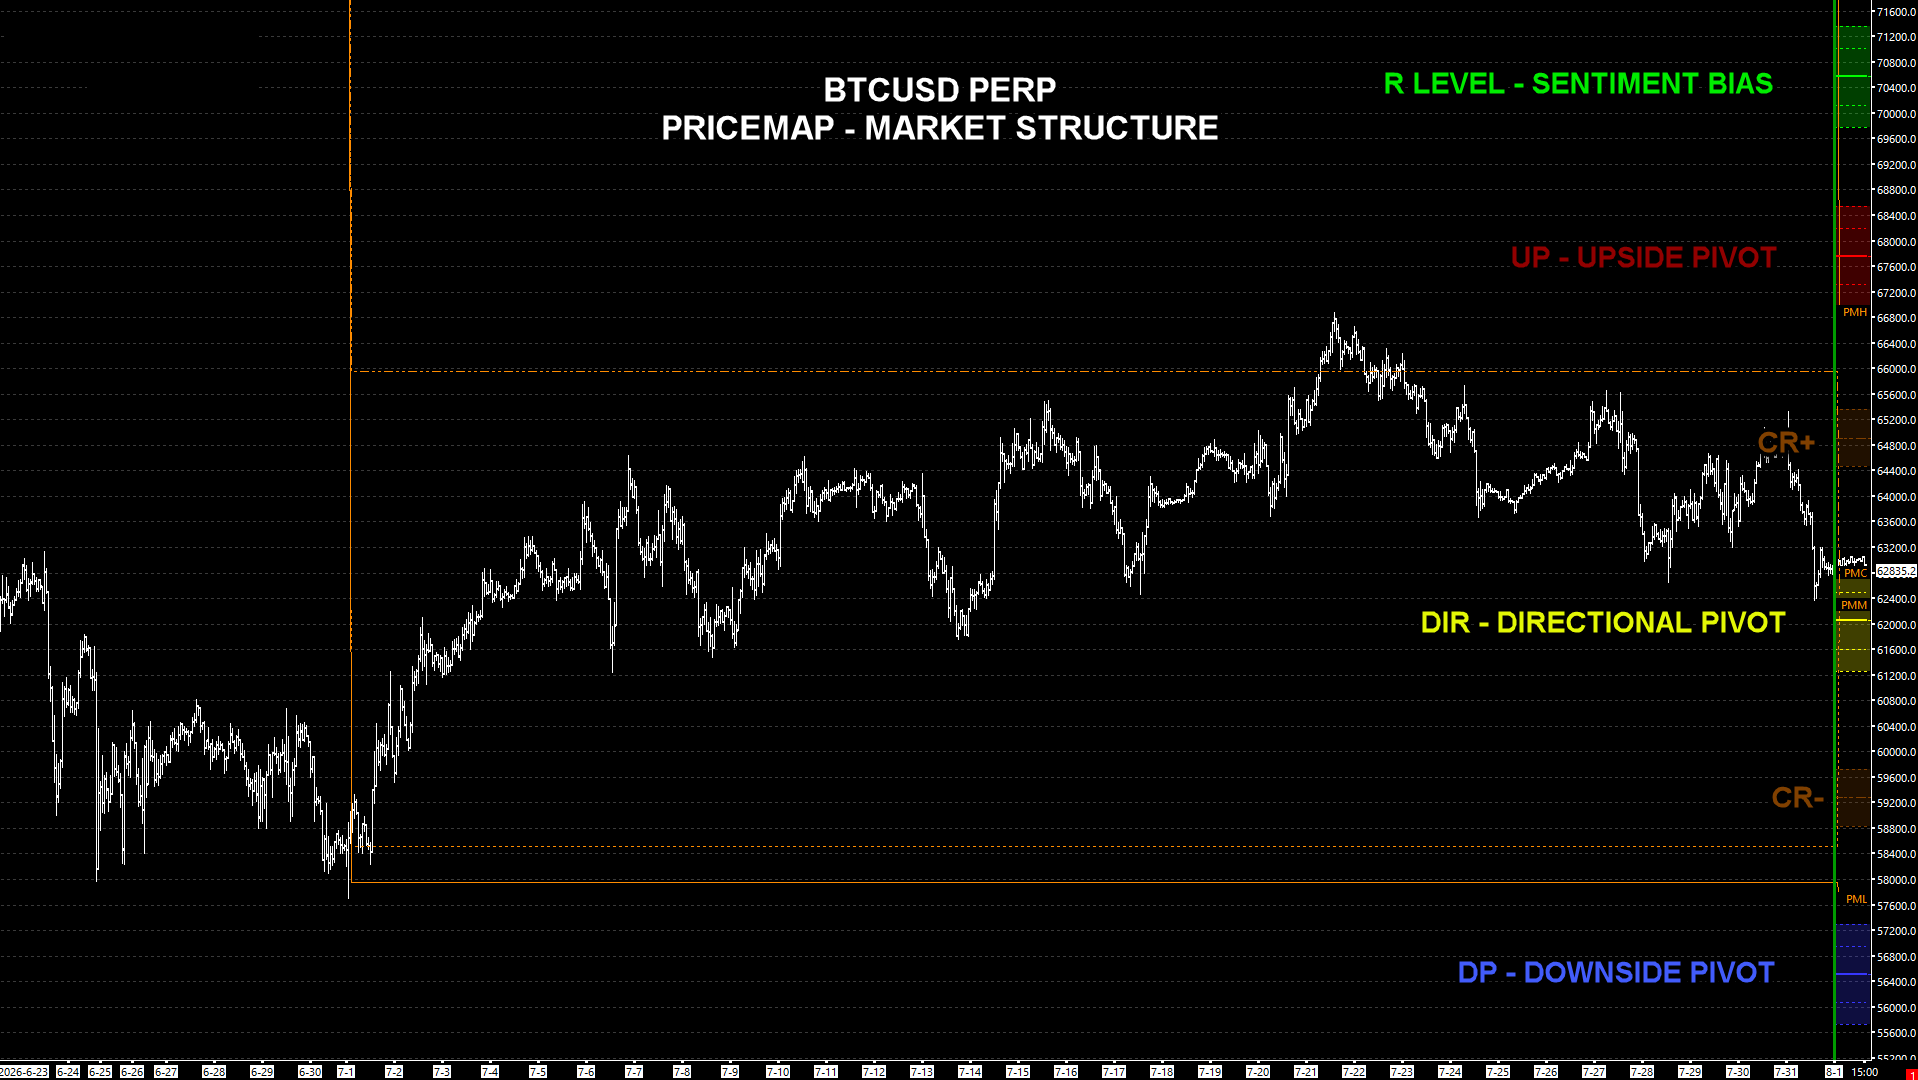
Here is what the PriceMap tells us. The R — the sentiment fulcrum — sits up at the CRX+, the upside extreme above the Critical Range. That is a negative regime (R6): sentiment parked above the market, bias to the downside, with the whole state contained up at the R. The R is the ceiling.
The DIR is the pivot point inside the Critical Range. Above it, the read is corrective — a grind higher against that negative sentiment, toward the R. Below it, negative and trending, in line with sentiment. That is what we know at the open: one pivot, two ways to go.
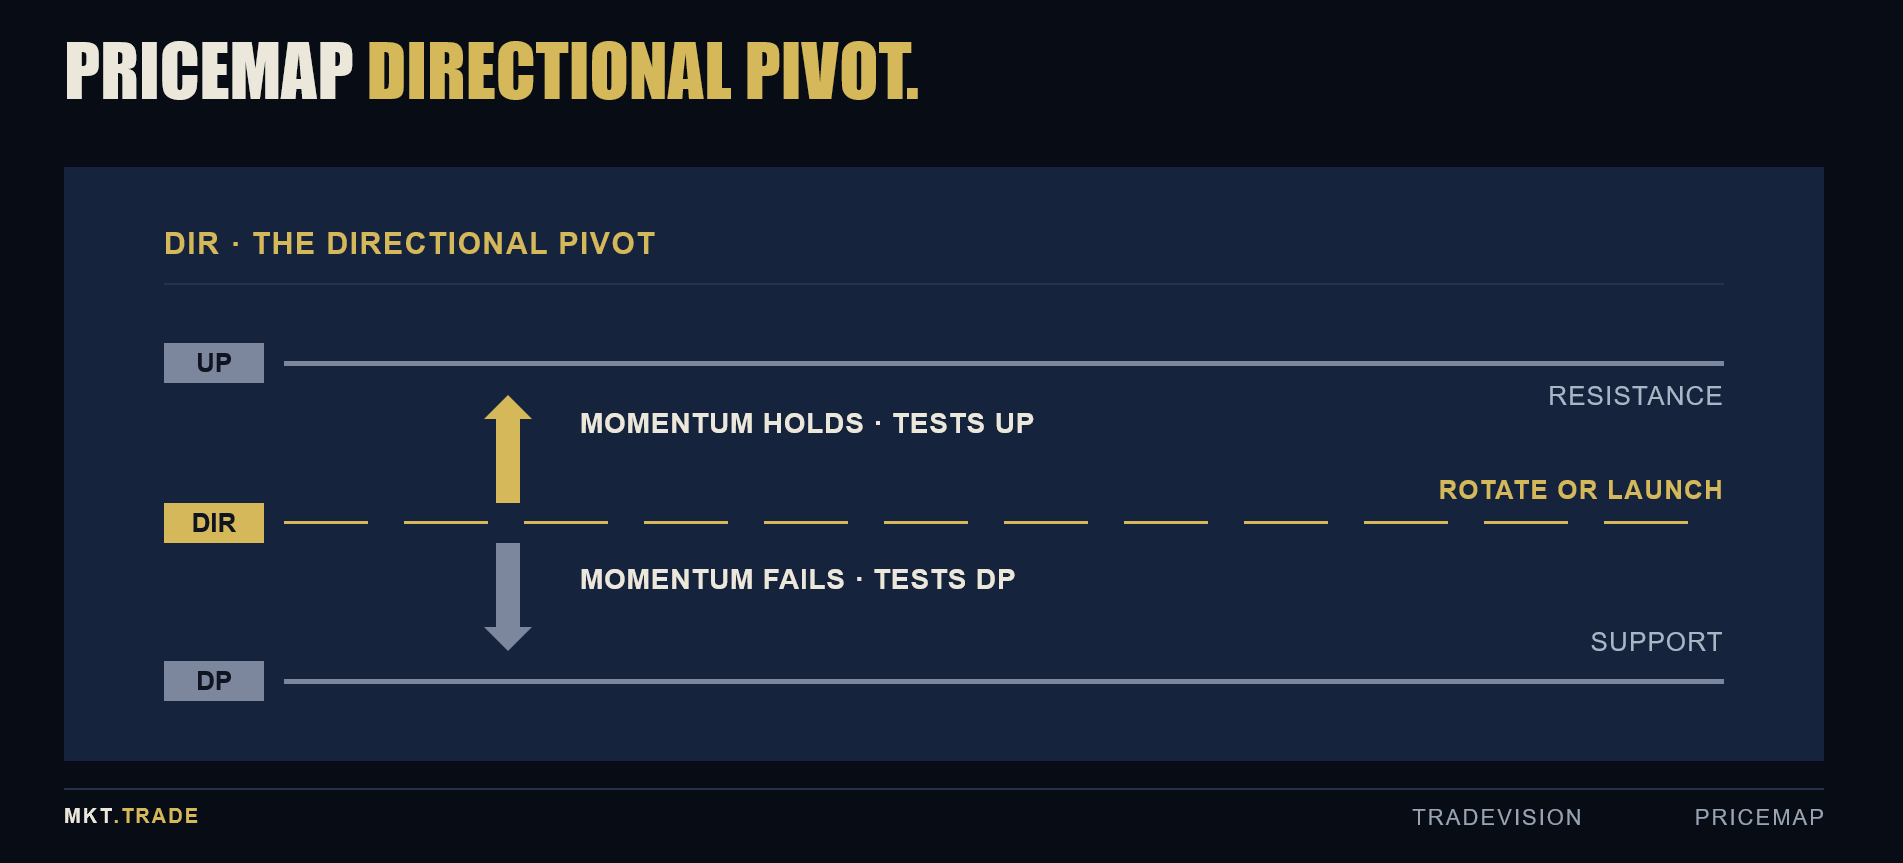
The Trade Vision on day one: price was holding above the DIR, and the Time Frame’s momentum band — the PMC and PMM — sits right inside the DIR’s metric boundary. Time Frame and PriceMap already agree on one price. So the read follows as fact: hold the DIR and that band, and the context is corrective — a grind up into the R sentiment bias above. If the DIR is the base, where can it go? The answer is the R. That is the story from the open; everything after is the market confirming it — or proving it wrong.
As the month opens, the auction finds equilibrium and prints the opening range — a high, a low, and a natural midpoint that stays valid through the whole period. For August: the ORH, ORM and ORL. Above the ORM the market is leaning higher; below it, be cautious. Until price leaves that range, it hasn’t committed.
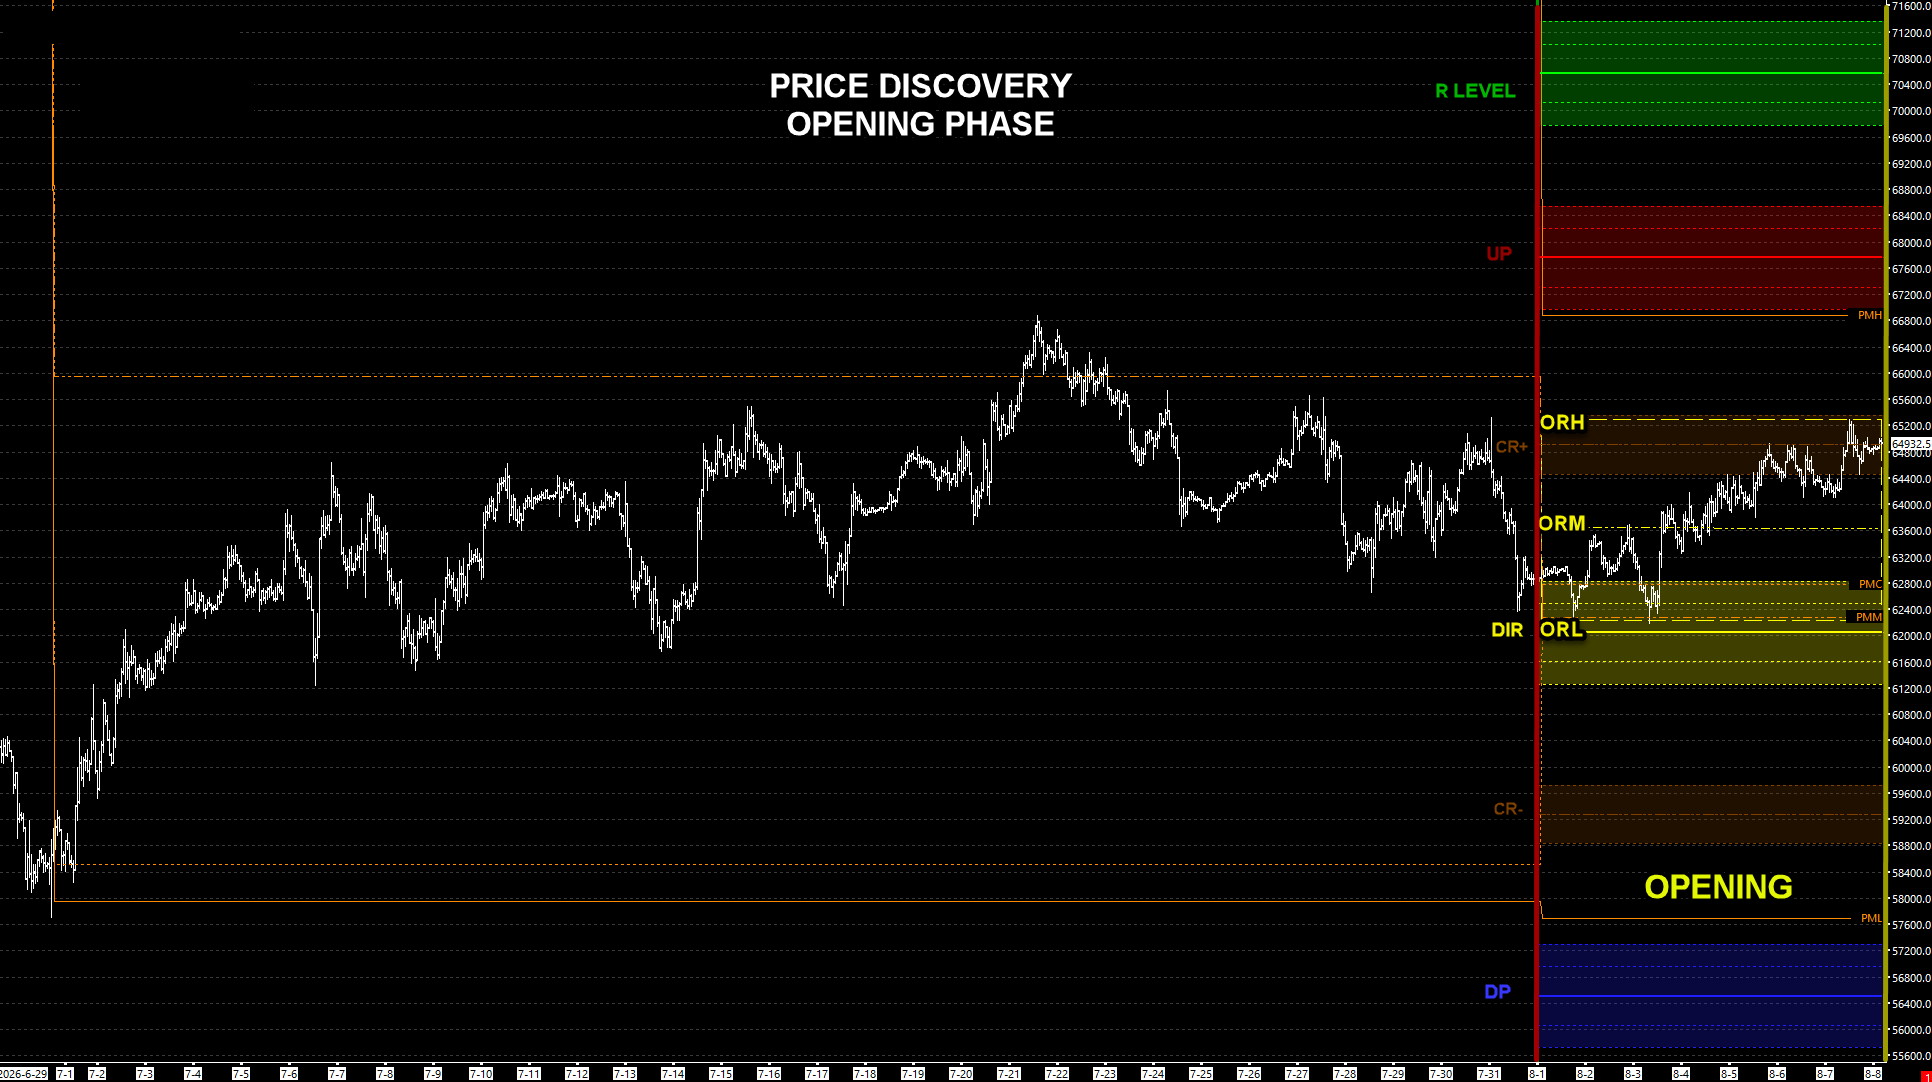
Here is what the opening phase told us: price could not validate above the CR+ to trigger the play toward the R. No green light yet — and that is fine. It is the market telling us to wait for it in the discovery phase. The day-one read stands; discovery has to confirm it.
The discovery phase does exactly what its name says: it challenges the extremes. Price pushed up to retest the ORH and the validation boundary — and failed to validate. It fell back to the ORM, failed to stabilize, and went to test the ORL, dropping into the key momentum zone where the PMC, PMM and the DIR stack together — the rotational pivot defined at the start of the month, doing its work.
So this is the hold-or-fold. If the market is good, it holds above the DIR and keeps correcting higher; if not, it breaks. It held the DIR to the figure.
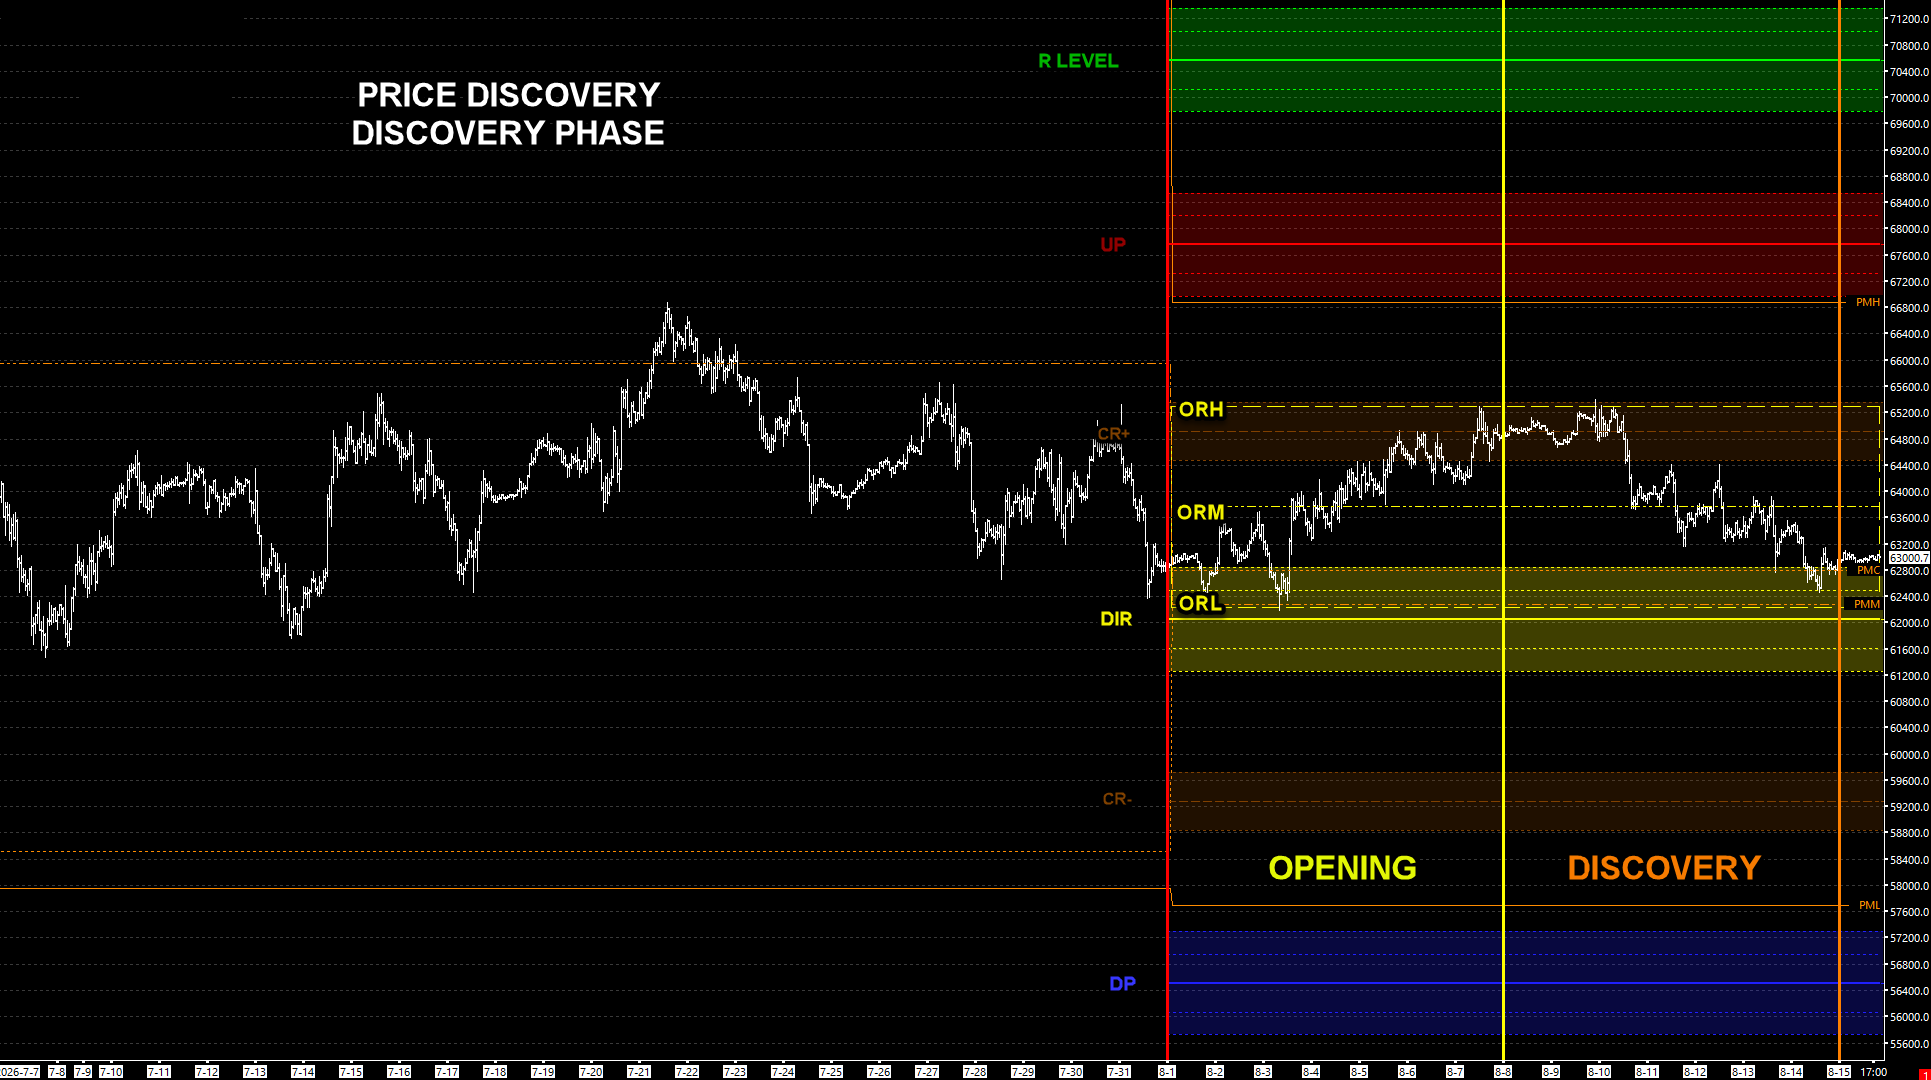
Notice what did not happen: nothing changed the day-one read. Discovery did exactly what discovery does — rotate through the ORM to test the ORL — and it held the DIR to the tick. Still corrective, still targeting the R. That is our story, and until price loses the DIR and proves it wrong, we are sticking to it.
Validation is where the market makes its move — and here the read from the 1st simply resumes. Nothing changed through discovery: the DIR held, the context stayed corrective, the target was still the R. Now watch price confirm it — and answer the one open “what if”: what if it doesn’t just correct up to the R, but transitions through it?
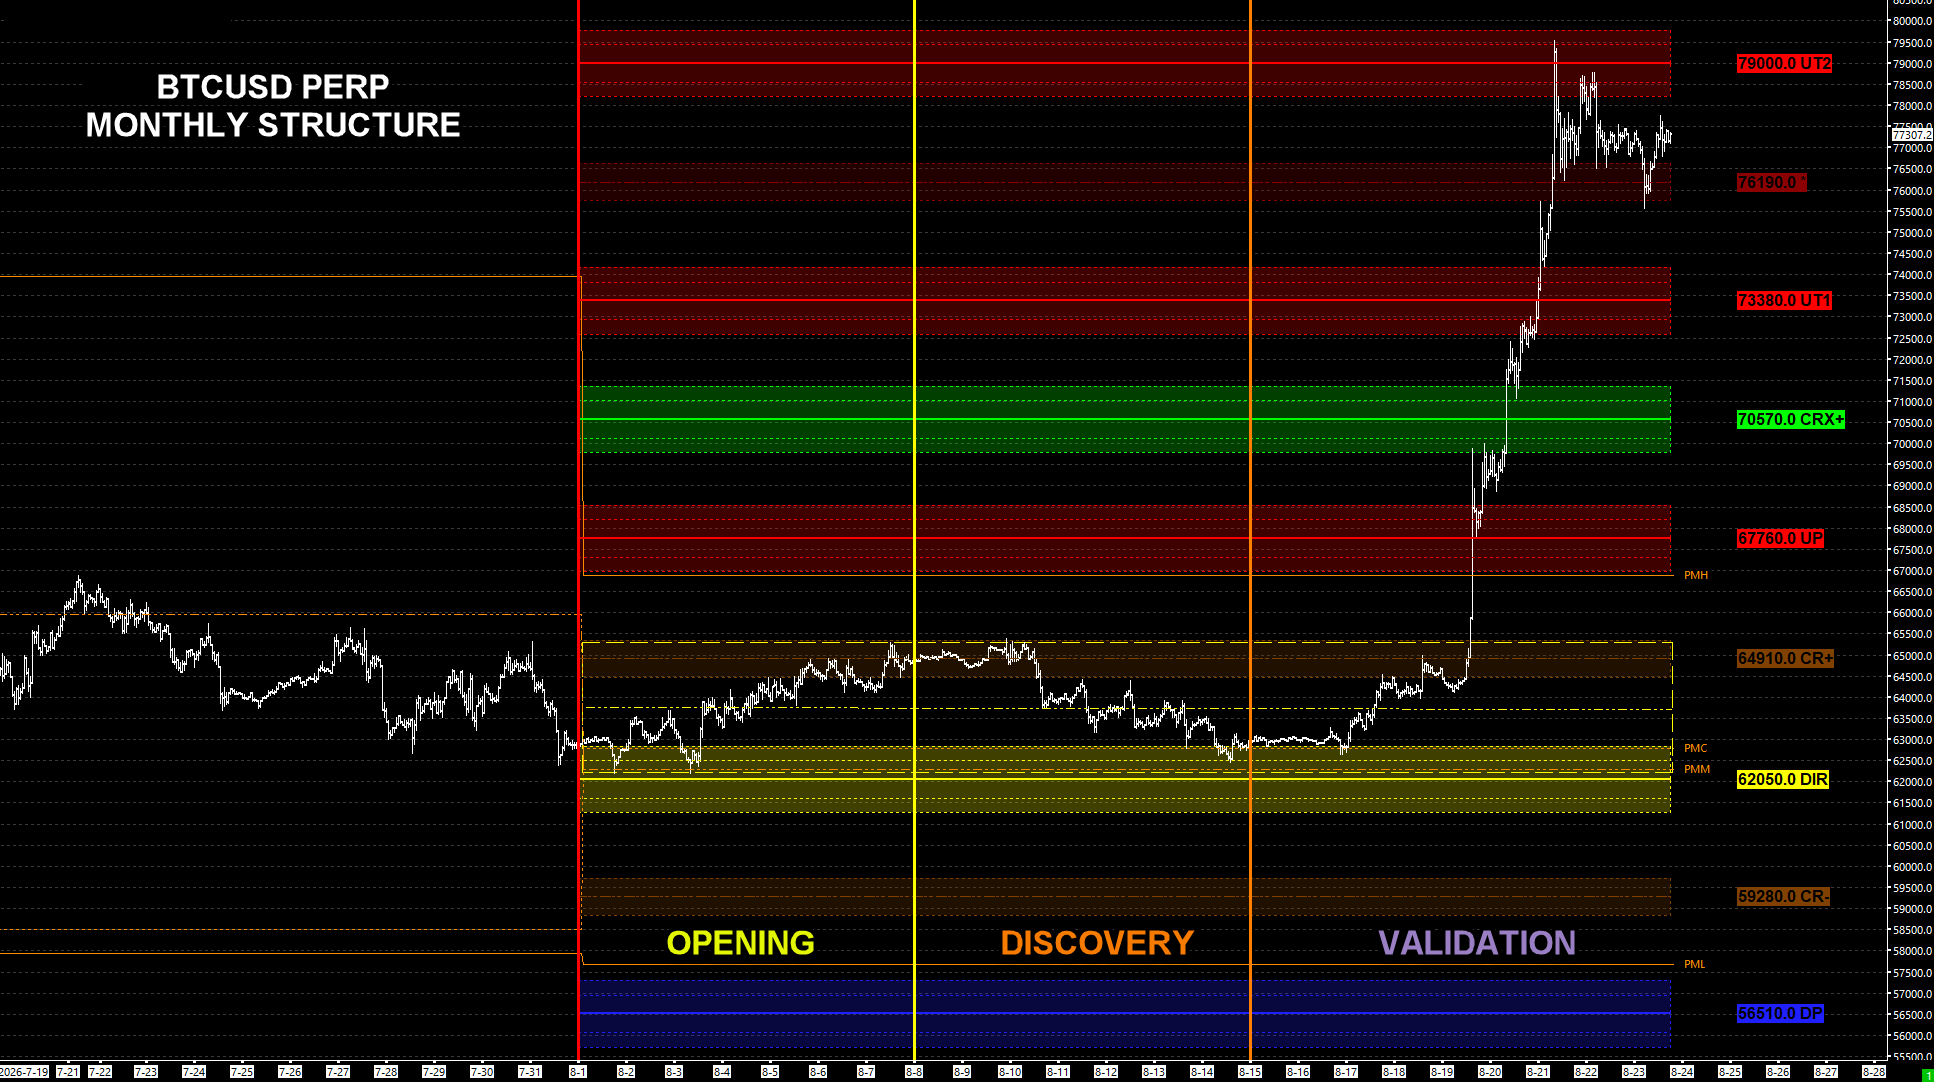
Above the ORM the positive lean was on — but still just a lean. The CR+, with the ORH, was the validation trigger: clear it and the corrective bias above the DIR is confirmed — the DIR breakout, targeting the R. Price cleared it.
It ran up and attained the R — the corrective target. Is that it, or does it push through? What do the facts say? Price is above the PMH, holding outside the Critical Range above the UP, and building positive price structure. That is a foundation of strength — and the BUY R BREAKOUT confirms it, targeting the UT2. Price tagged the UT2 zone and trades just under it today. Up to date.
At every inflection, the question was the same: does price agree with the structure? It agreed at the DIR — held, with the Time Frame and the opening range aligned to it — through the CR+ and the UP, and broke the R. When price confirms the structure at every step like that, you are not guessing what it might do — the market is telling you what it is doing. You only decide whether to accept it.
The transition has played out. Price cleared the R ($70,570), ran the BUY R BREAKOUT, tagged the UT2 ($79,004) target, and eased back below it. Target attained, gains held, still well above every prior-period high. That is a pause, not a top. And one line now governs the balance of the month: Monthly UL02 ($76,190).
Hold above the UL02 ($76,190) and momentum stays intact — the UT2 ($79,004) is the pivot to clear for the next leg, then $81,820 → $84,630 → the UT3 ($87,438) for a strong month-end. Fail below the UL02 and the move goes to digestion: a shallow pullback to the UT1 ($73,380) (month still ends strong), or the deeper, full corrective back to the R ($70,570) — the more likely path into a wily settlement trade, which begins on the 25th. The transition holds as long as price stays above the R; below that, and only there, does the positive read come off. One line decides which.
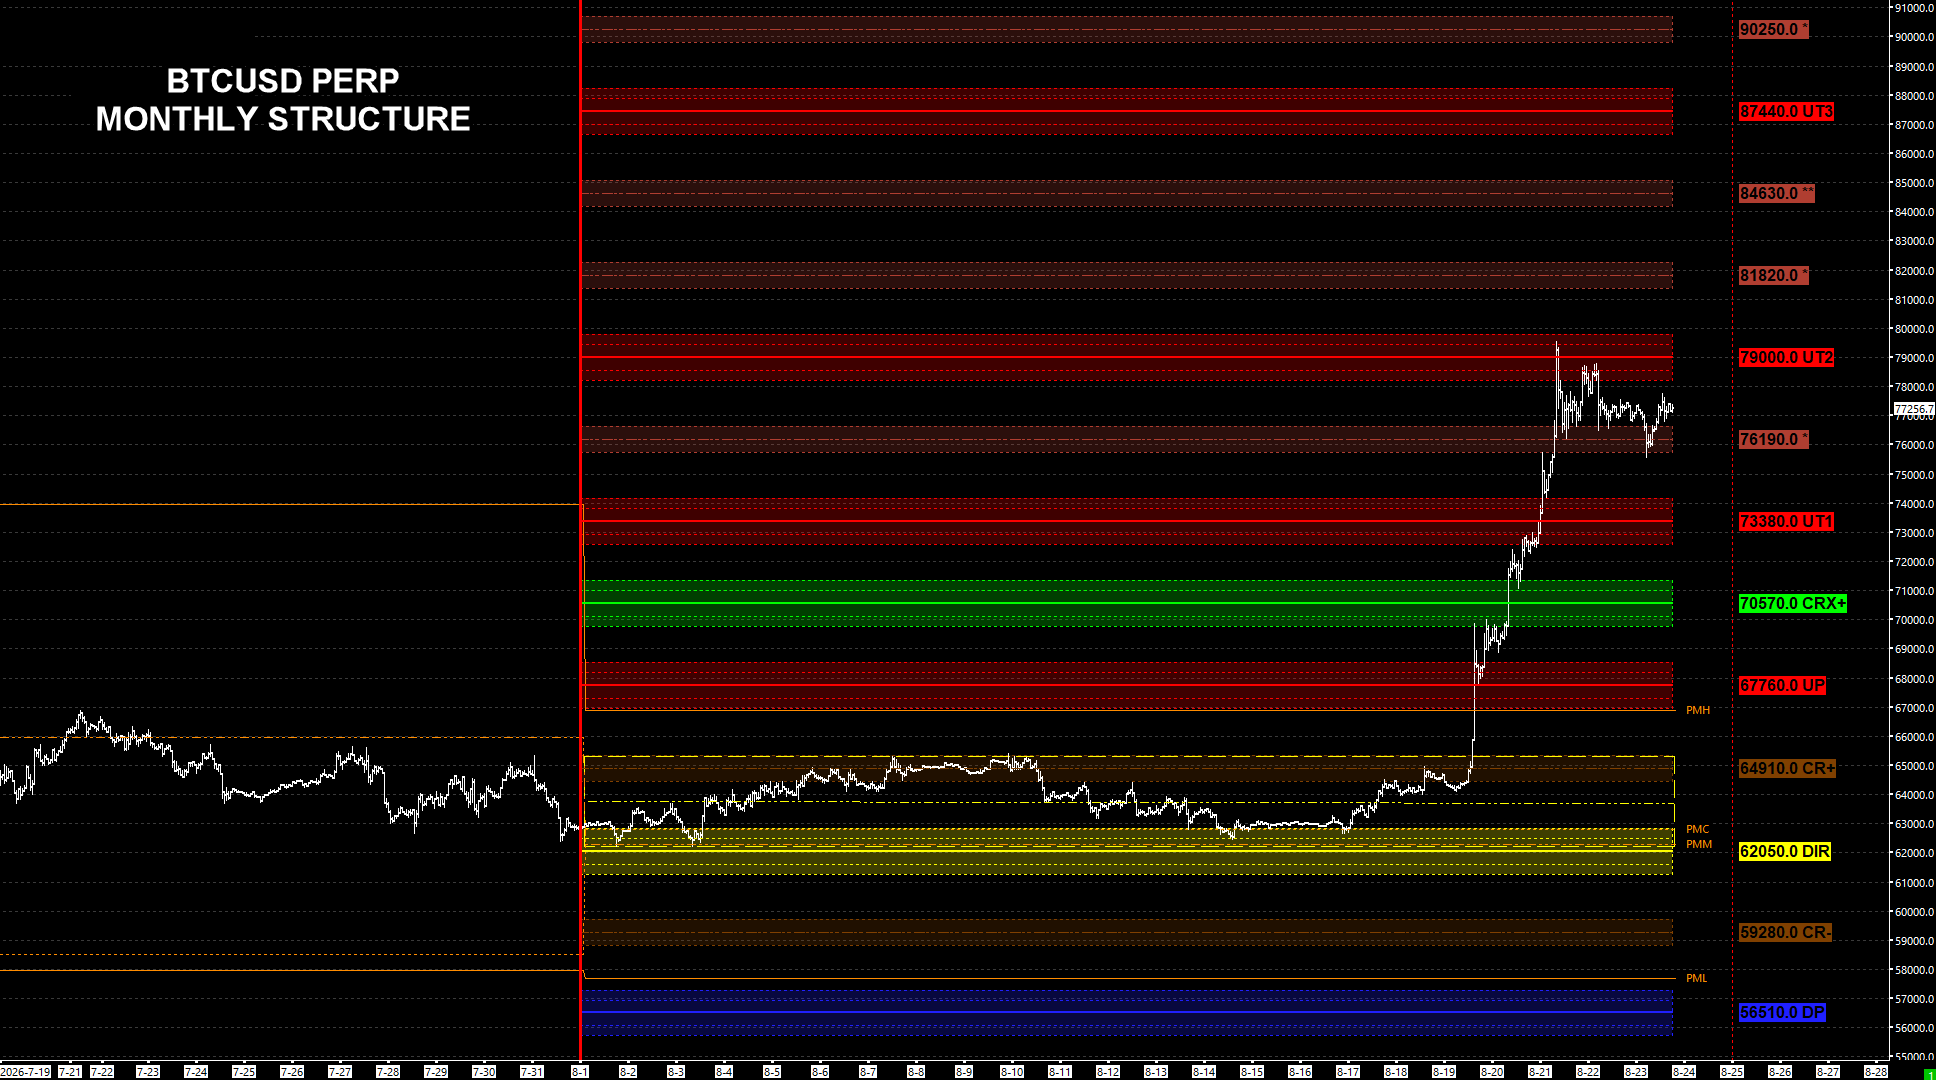
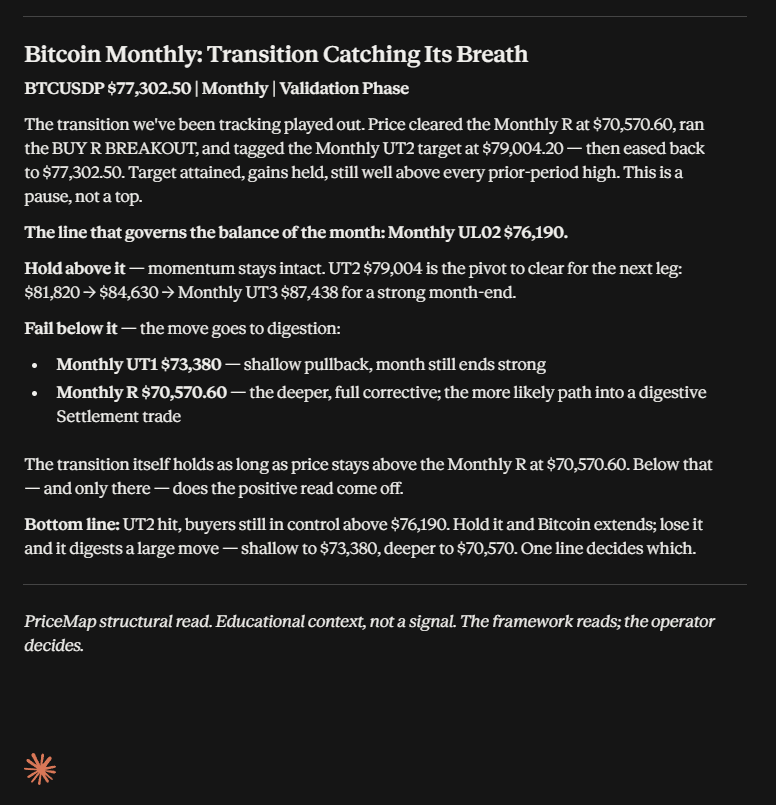
Everything above is transparent and repeatable — you can build it yourself, layer by layer. This is where Navigator, our AI agent, comes in. The read below is a live Navigator pull, taken on this same structure before we posted — not dressed up after the fact, just the agent’s own read.
Navigator has access to the full market-intelligence stack — the PriceMap structure, levels, metrics and regime you just walked — with 40 years of Decision Intelligence experience embedded in it. It surfaces every layer of detail behind the outlook. You remain the operator: it does not tell you what to do; it lays out the facts, and you decide whether to accept them.
One note on scope: this entire read is the Monthly. It stands on its own, but the highest-resolution decisions come when the timeframes agree. Lining the Monthly up with the Weekly, Daily and Quarterly — cross-timeframe alignment — is the follow-up post.
Every level here — the R, the Critical Range, the DIR, the targets — comes off the same PriceMap, applied identically to any market, any timeframe. It is what turns watching price into reading it. See how it is built on the PriceMap page →