Building the Fact Foundation
Most traders watch price and react. The screen moves, emotion picks the trade, and by Friday you can’t separate skill from luck. The fix isn’t a better prediction — the market doesn’t need predicting, it needs understanding. It’s a fact foundation: a fixed set of truths you establish before the session, so the decision in the moment is already framed.
That foundation is built and read in layers. The top layer is the one you watch: price structure — the live swings, dynamic, always moving. Beneath it, two fixed layers give it context: the Time Frame (last period’s footprint) and the Time Phase (where price sits in its discovery). Those three are public information — anyone can see them. Beneath all of them is the foundation that never moves and is never overridden: Market Structure — the PriceMap. Let’s build it up, one layer at a time, live on the Monthly 10-Year.
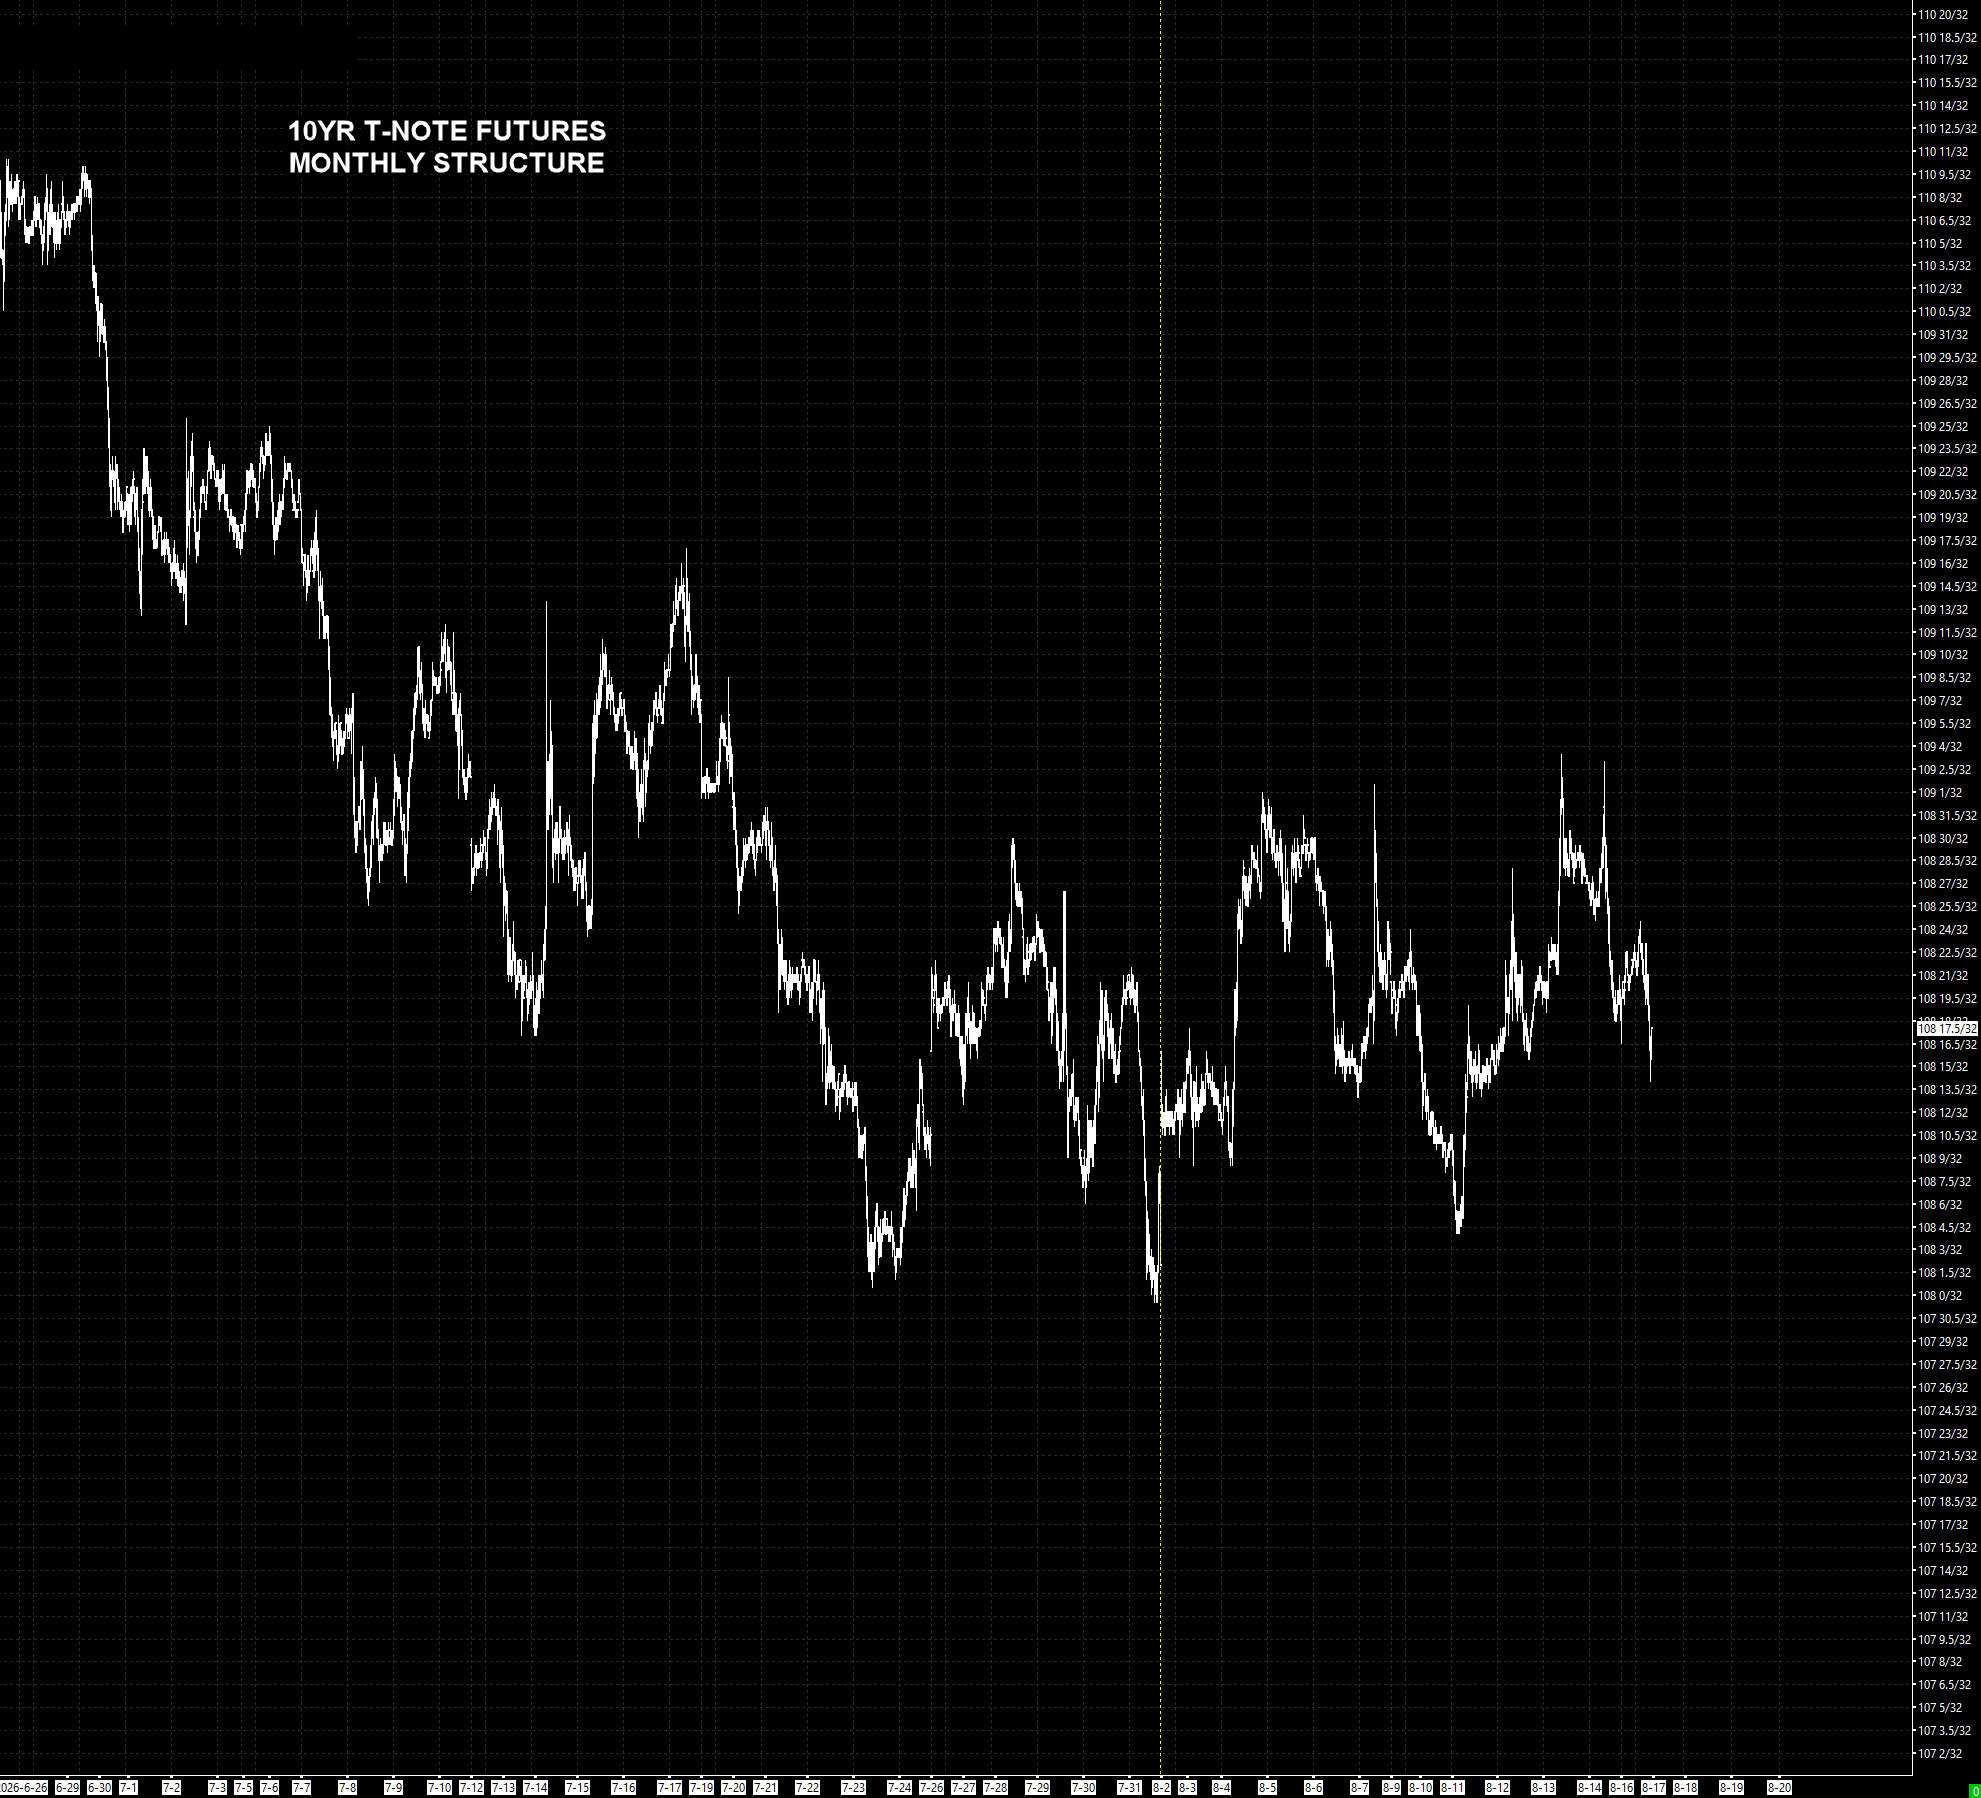
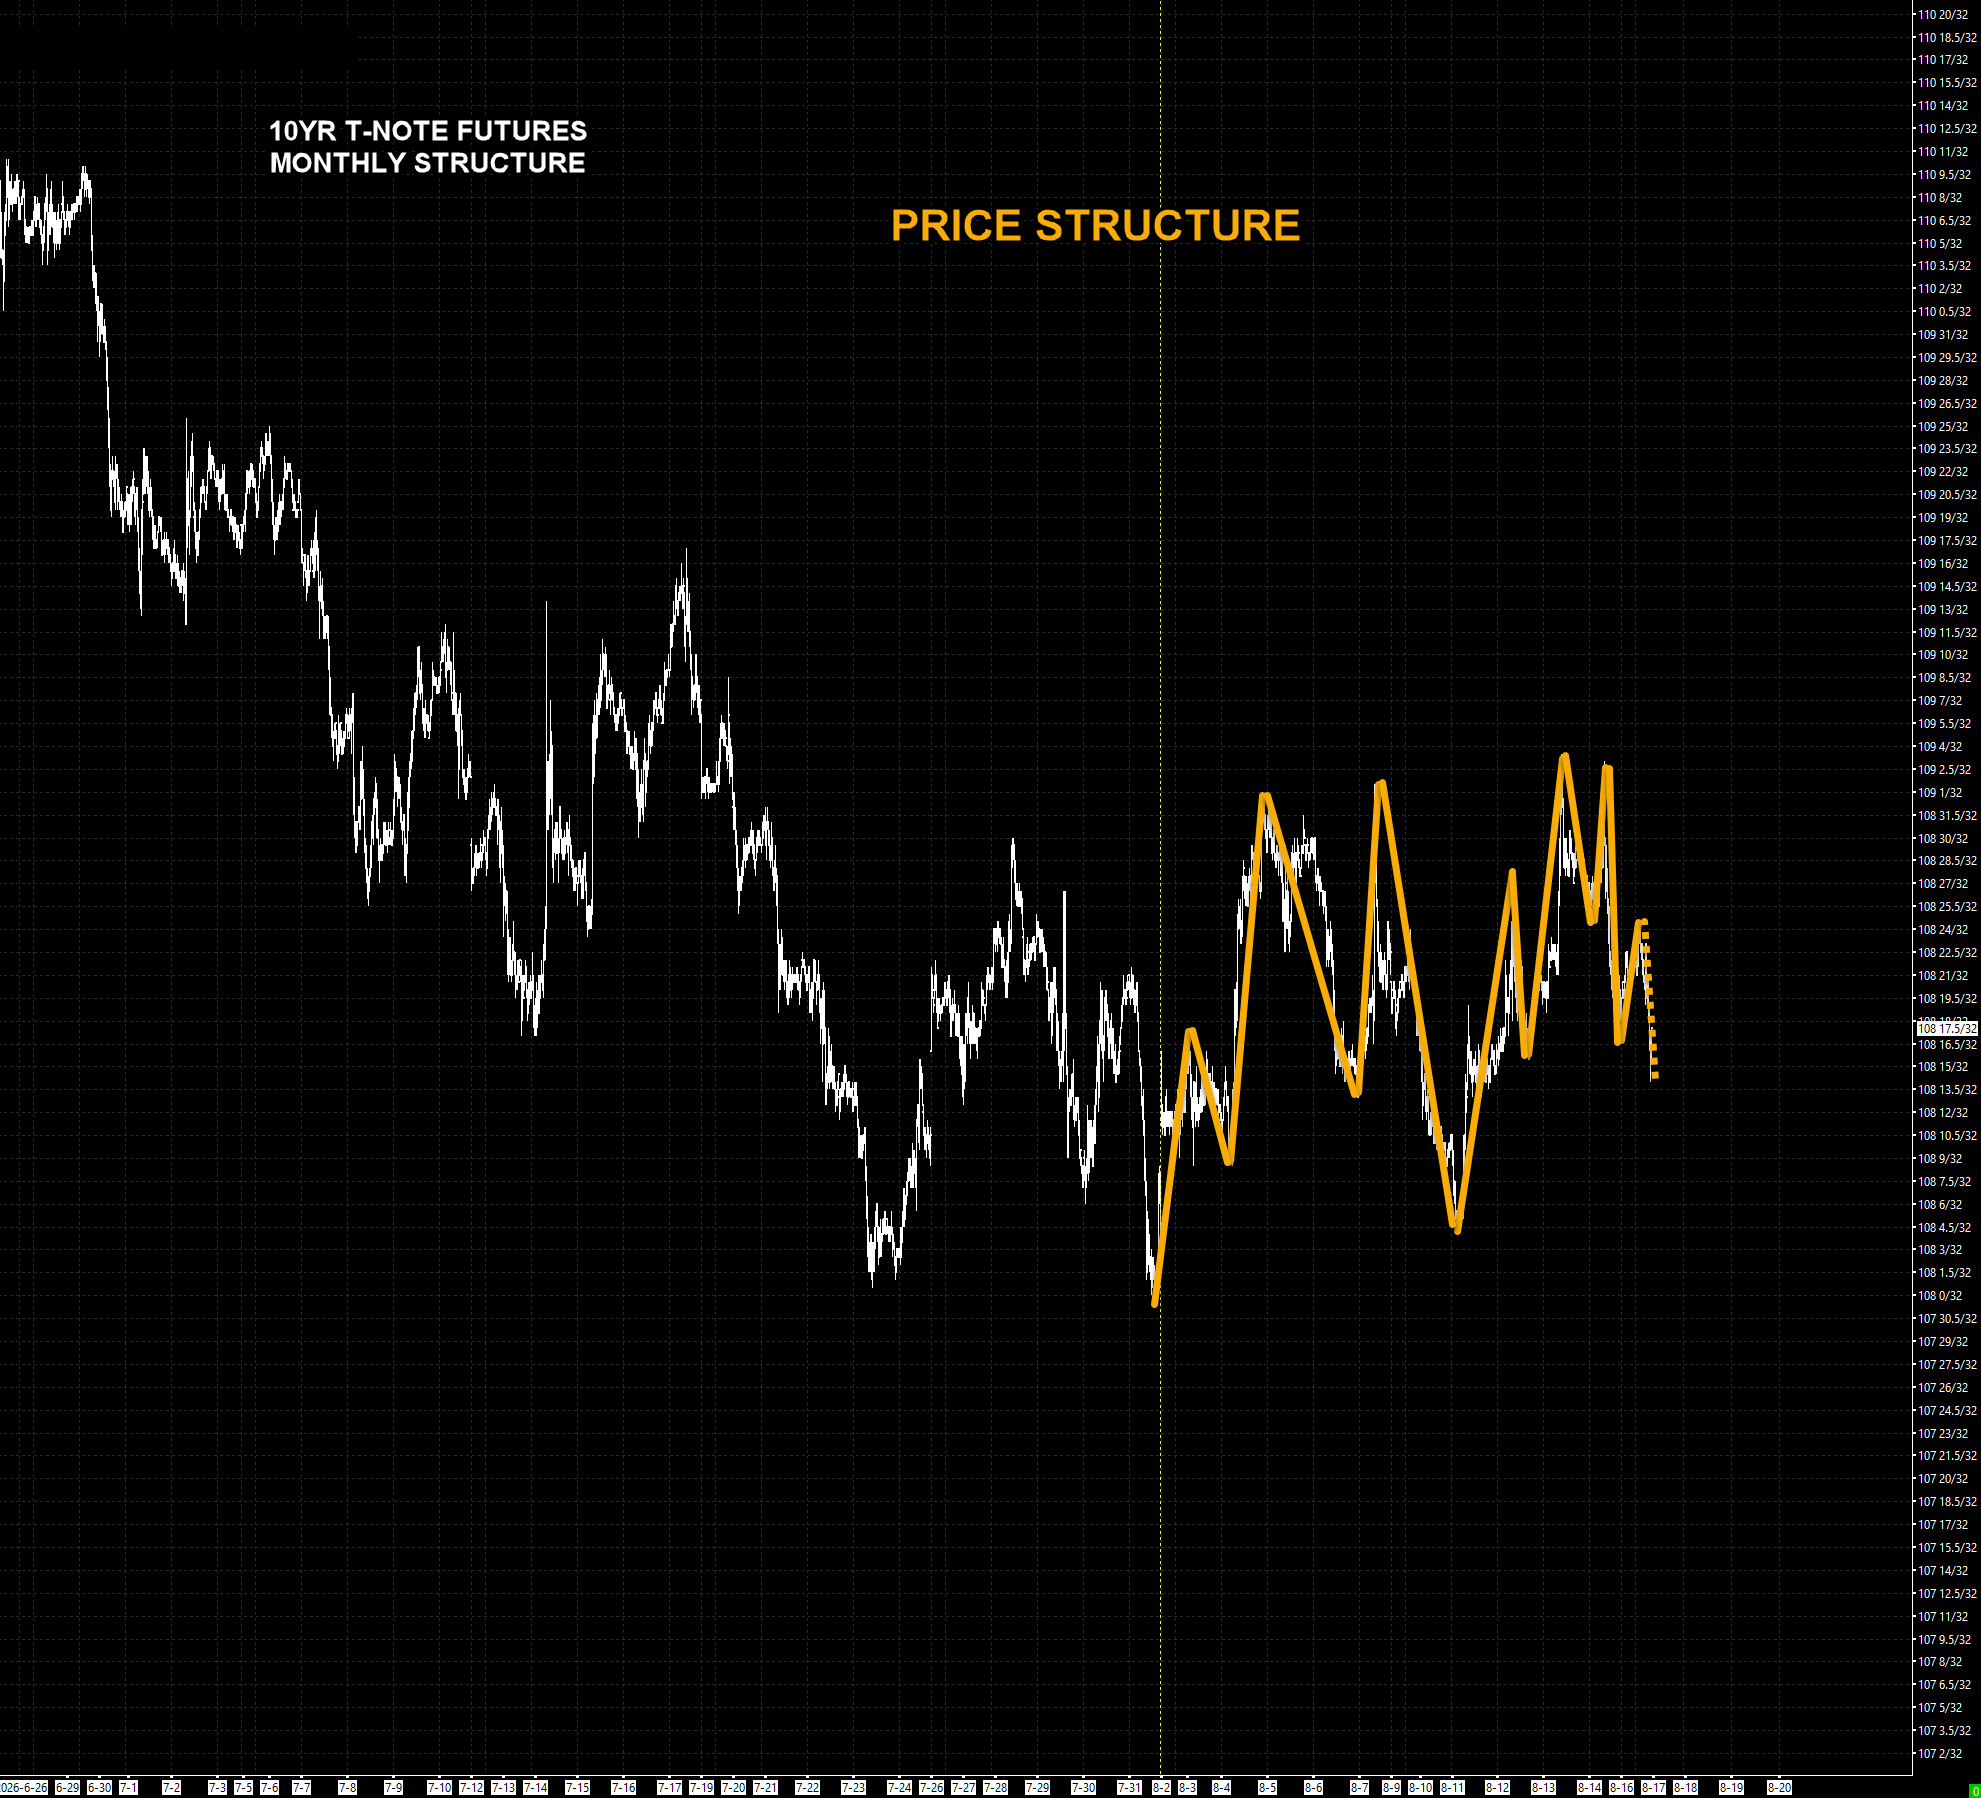
Price structure is the live swing — the highs and lows the market is printing right now. It is dynamic; it is the thing your eye follows. And it tells you plenty on its own: whether the market is making higher highs and higher lows (trending up), lower lows and lower highs (trending down), or neither — overlapping, non-trending, going nowhere. It even marks the 1st and 2nd structure breaking points: the levels where the current swing sequence would fail. What it can’t give you on its own is the fixed context underneath — where these swings sit relative to what is already true.
The price structure is non-trending. The swings overlap — no clean sequence of higher highs and higher lows, none of lower lows and lower highs — a market rotating, not going anywhere. Character read, breaking points marked. Now we need the context underneath.
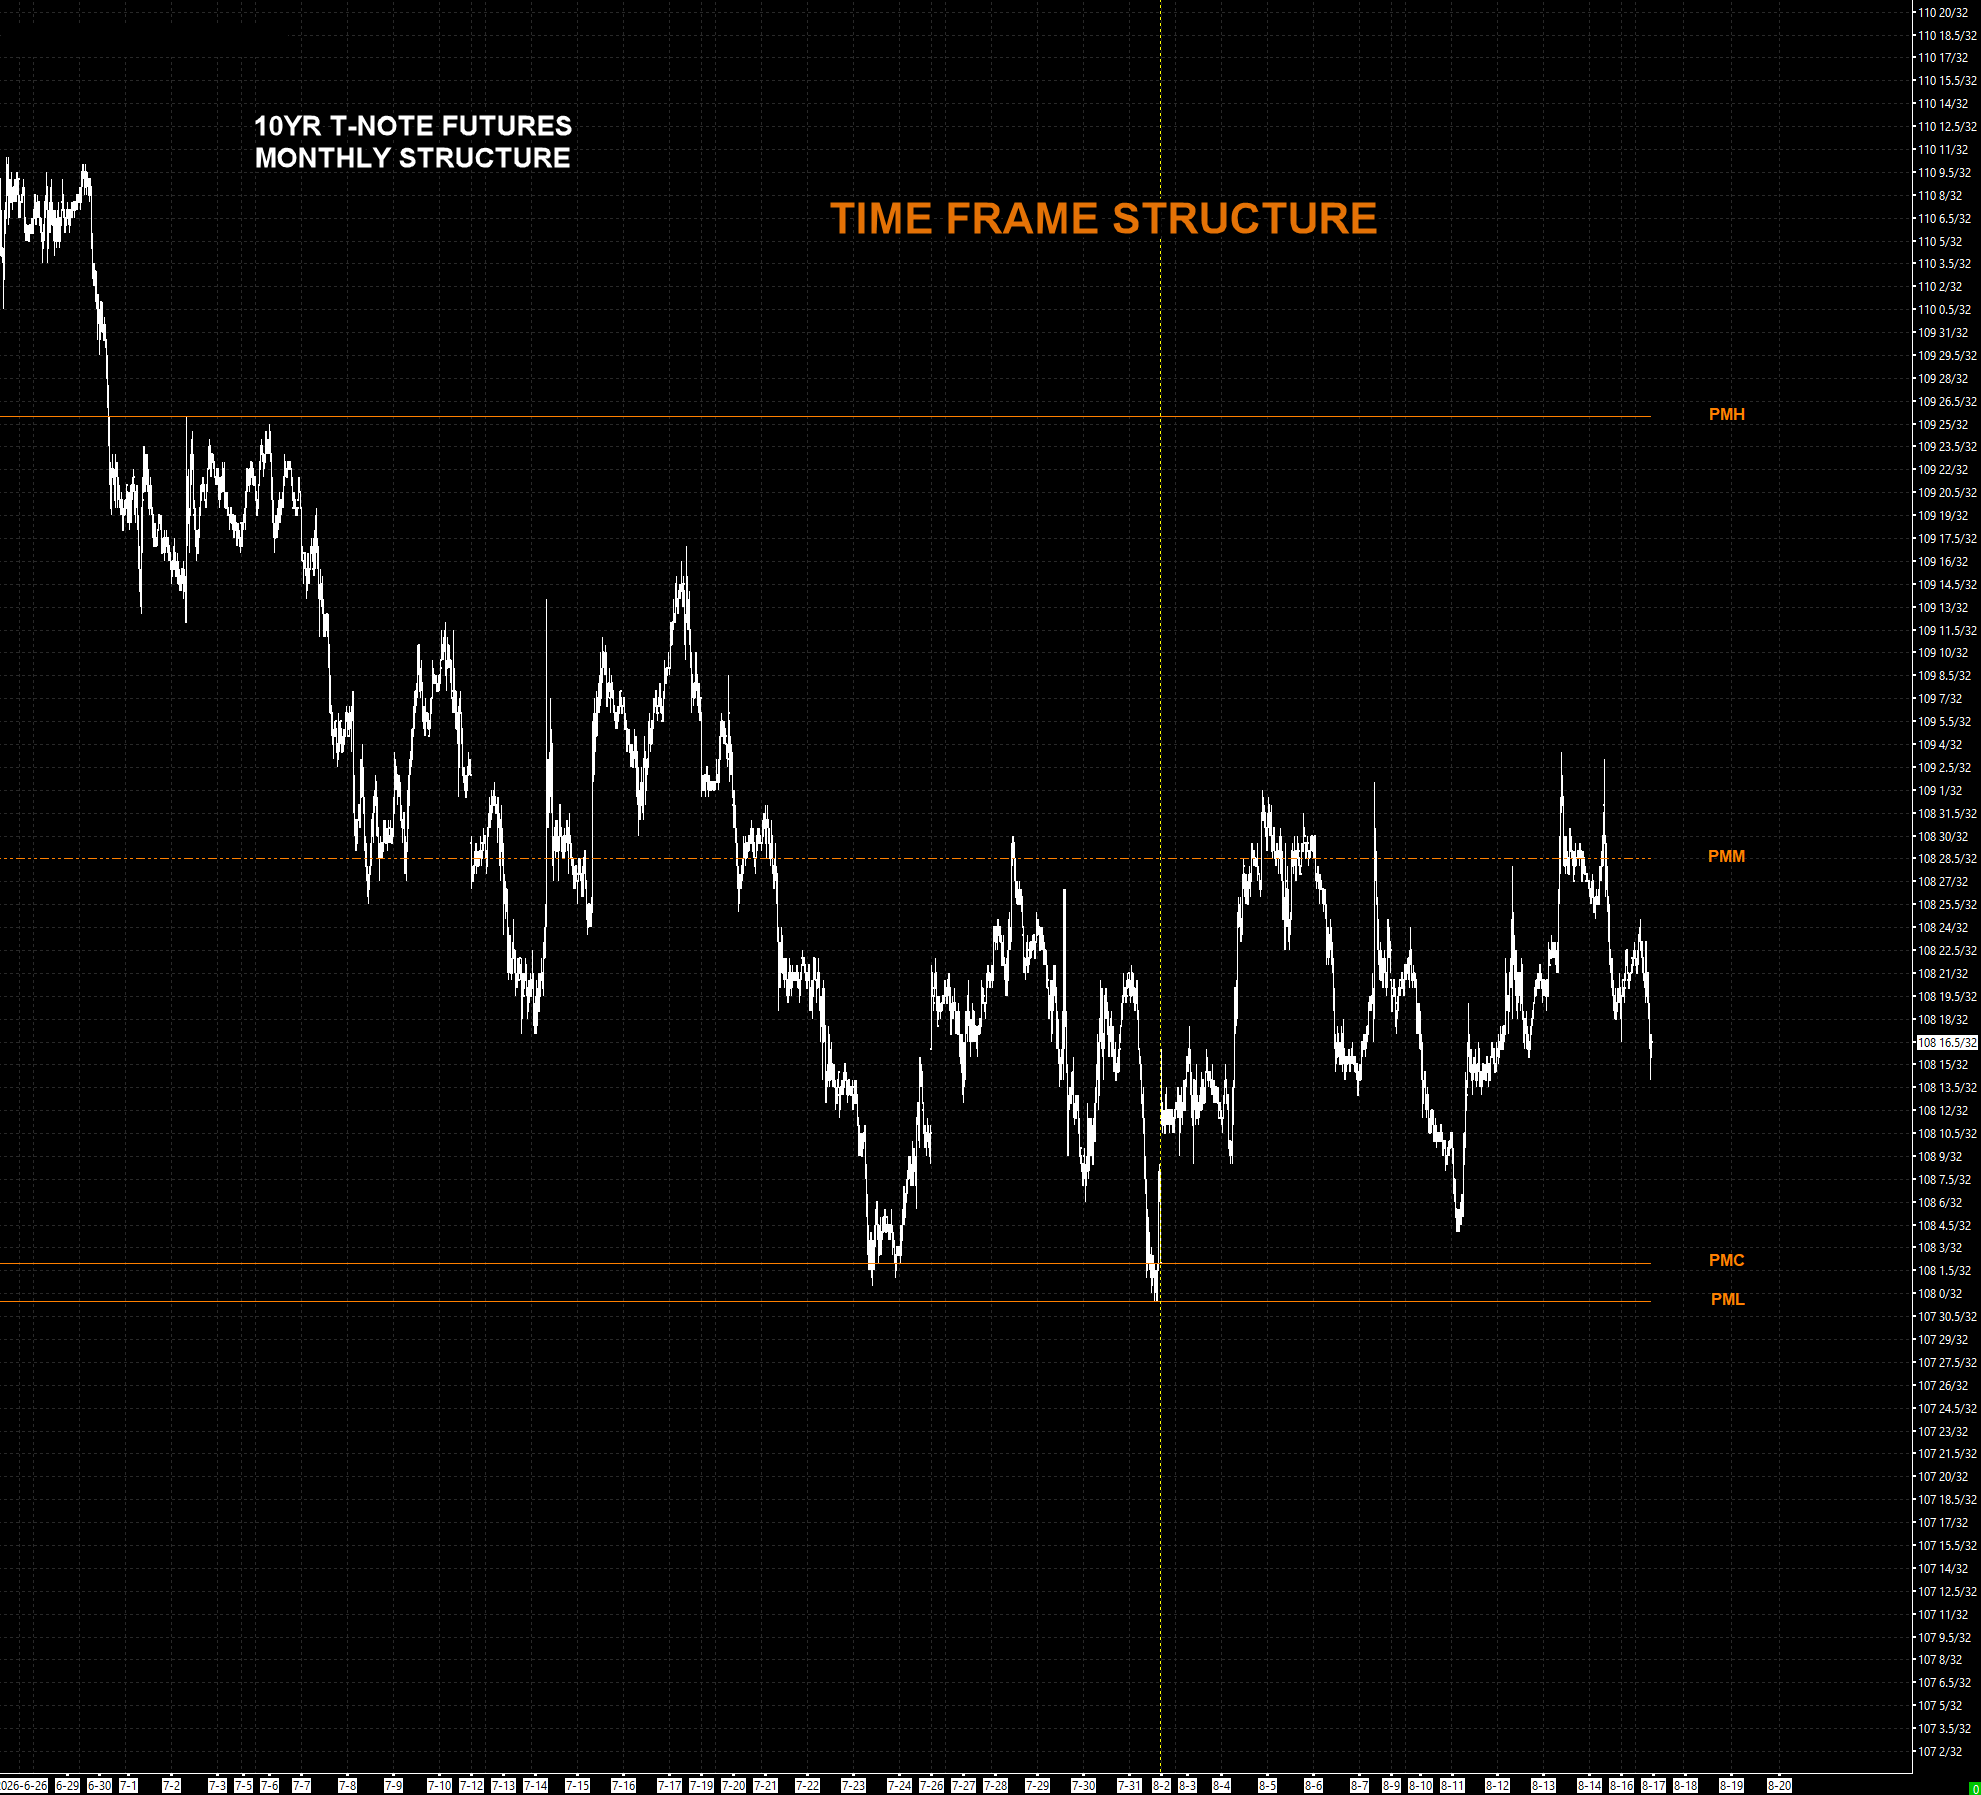
The Time Frame is last period’s footprint — the Previous Month High, Midpoint, Close and Low (PMH / PMM / PMC / PML). Fixed numbers, set before the month trades a tick. They answer one question: are we doing better or worse than last month? Above the PMC is positive; above the PMM is trending; below the PMM is corrective.
The note bounced off the PML–PMC lows but has been unable to sustain a reclaim of the PMM. That failure to hold the midpoint gives the market a soft, sideways tone — consistent with the non-trending price structure. Two layers agree.
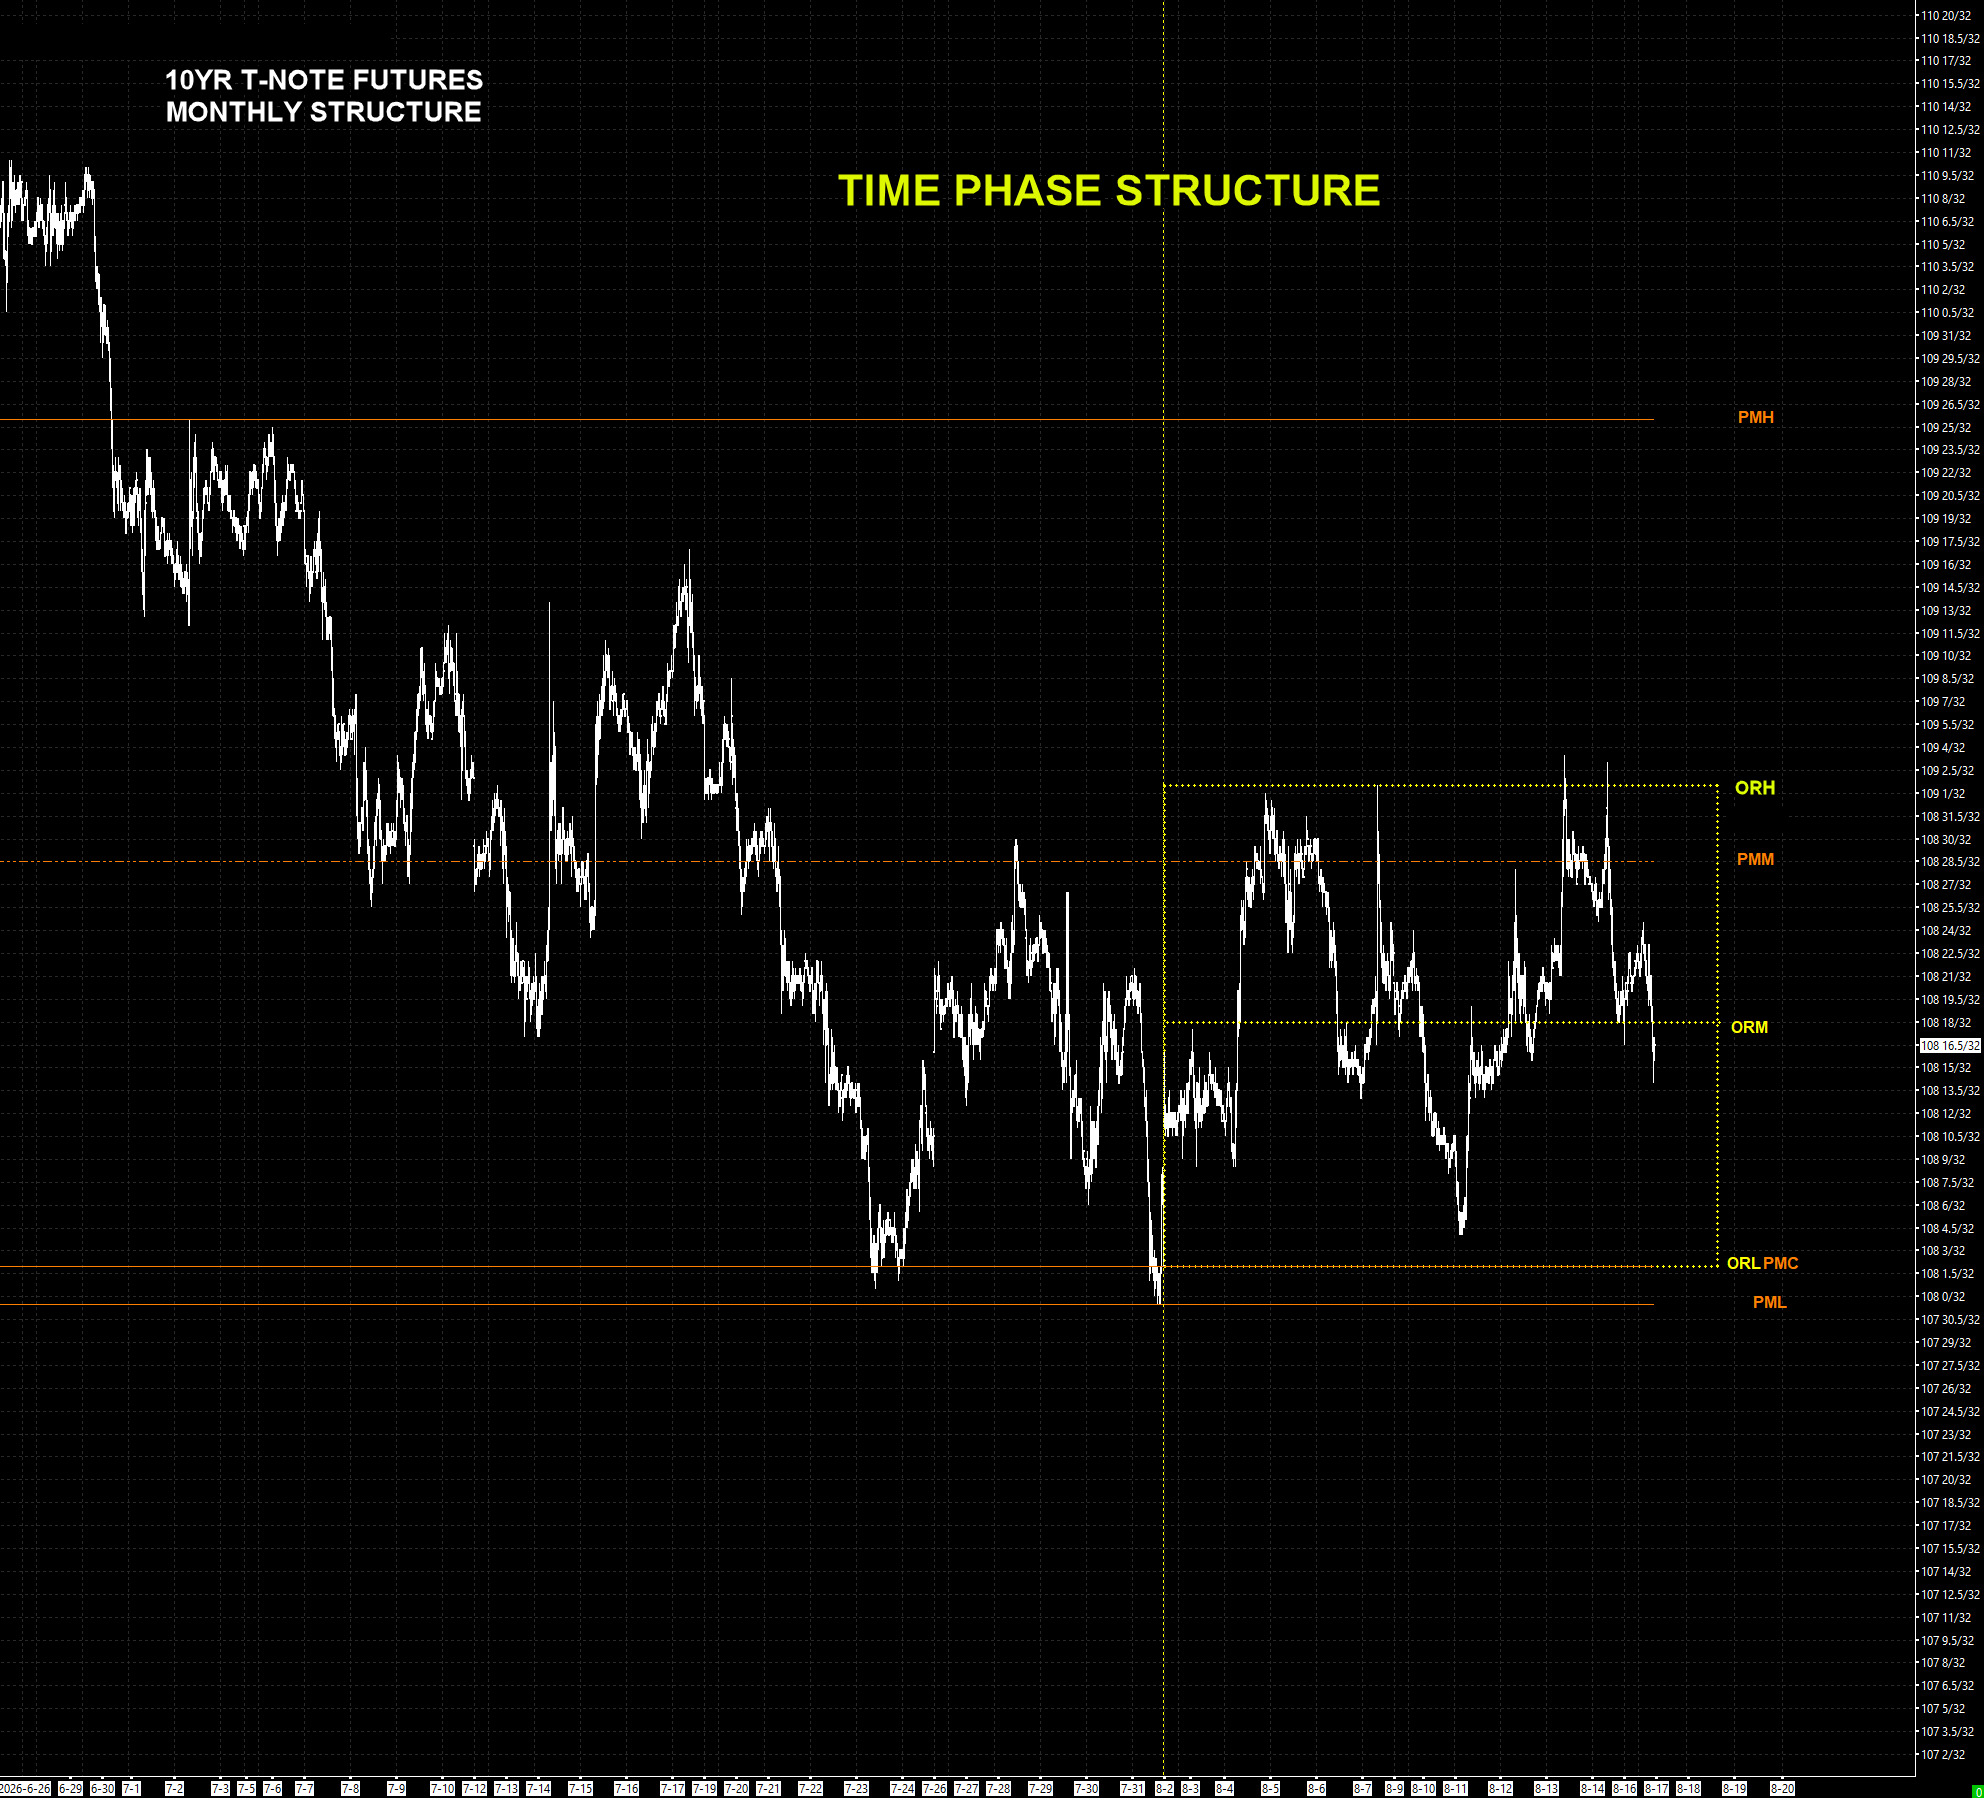
Time Phase is where the month sits in its price discovery — the Opening Range: High, Midpoint and Low (ORH / ORM / ORL), set early and then settled against through the period. It refines the Time Frame bias into a tighter, actionable band.
The ORH extended the direction of the PMM midpoint bias up — refining the exact price point that must be reclaimed to shift momentum positive and target the PMH. Right now the market is using the ORM as its pivot: hold it and it can retest the ORH; lose it and it works the ORL into the back end of the month. This sharpens our state awareness — but it is still context, not the foundation.
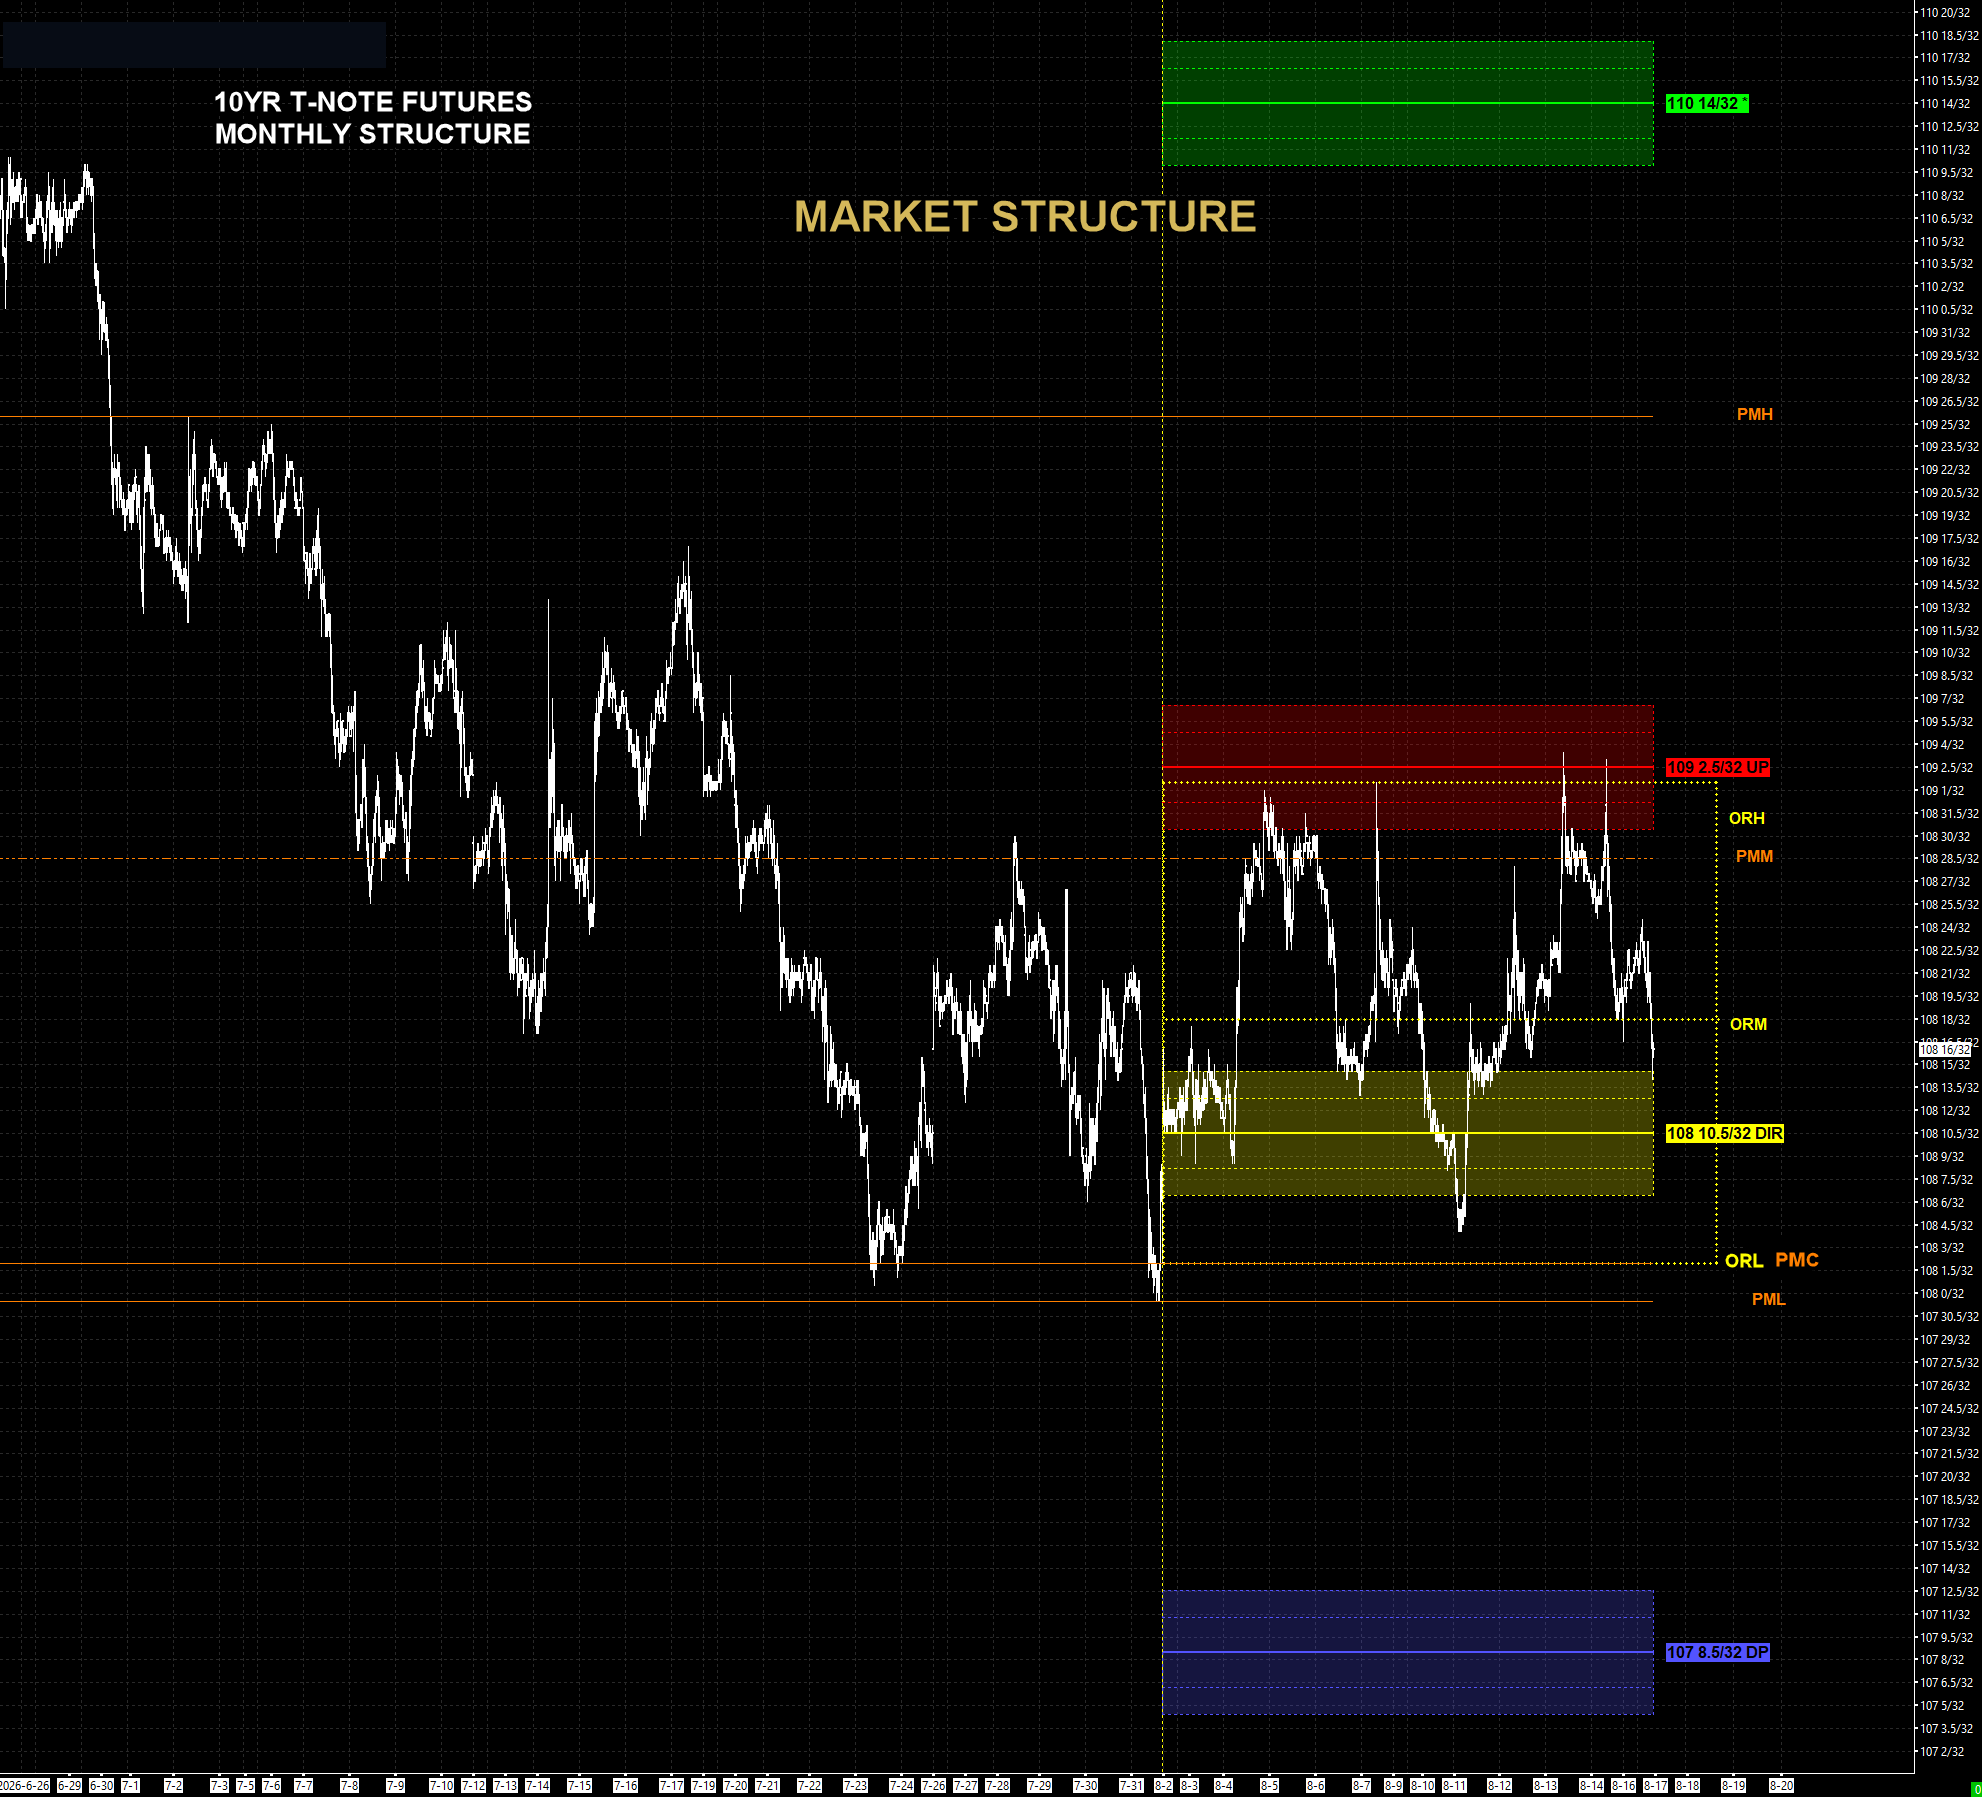
Now read the whole thing within Market Structure. Nothing about price changed — the same swings, the same Time Frame, the same Time Phase — but the picture comes into focus. What read as a market rotating with no clear tone now sits inside a frame that tells you where it actually is: which levels are holding it, and which one it has to take to change state. Context becomes clarity. This is where awareness shifts. You stop reacting to what price is doing and start reading what is true right now — and the exact level where that truth changes. That is Market Structure.
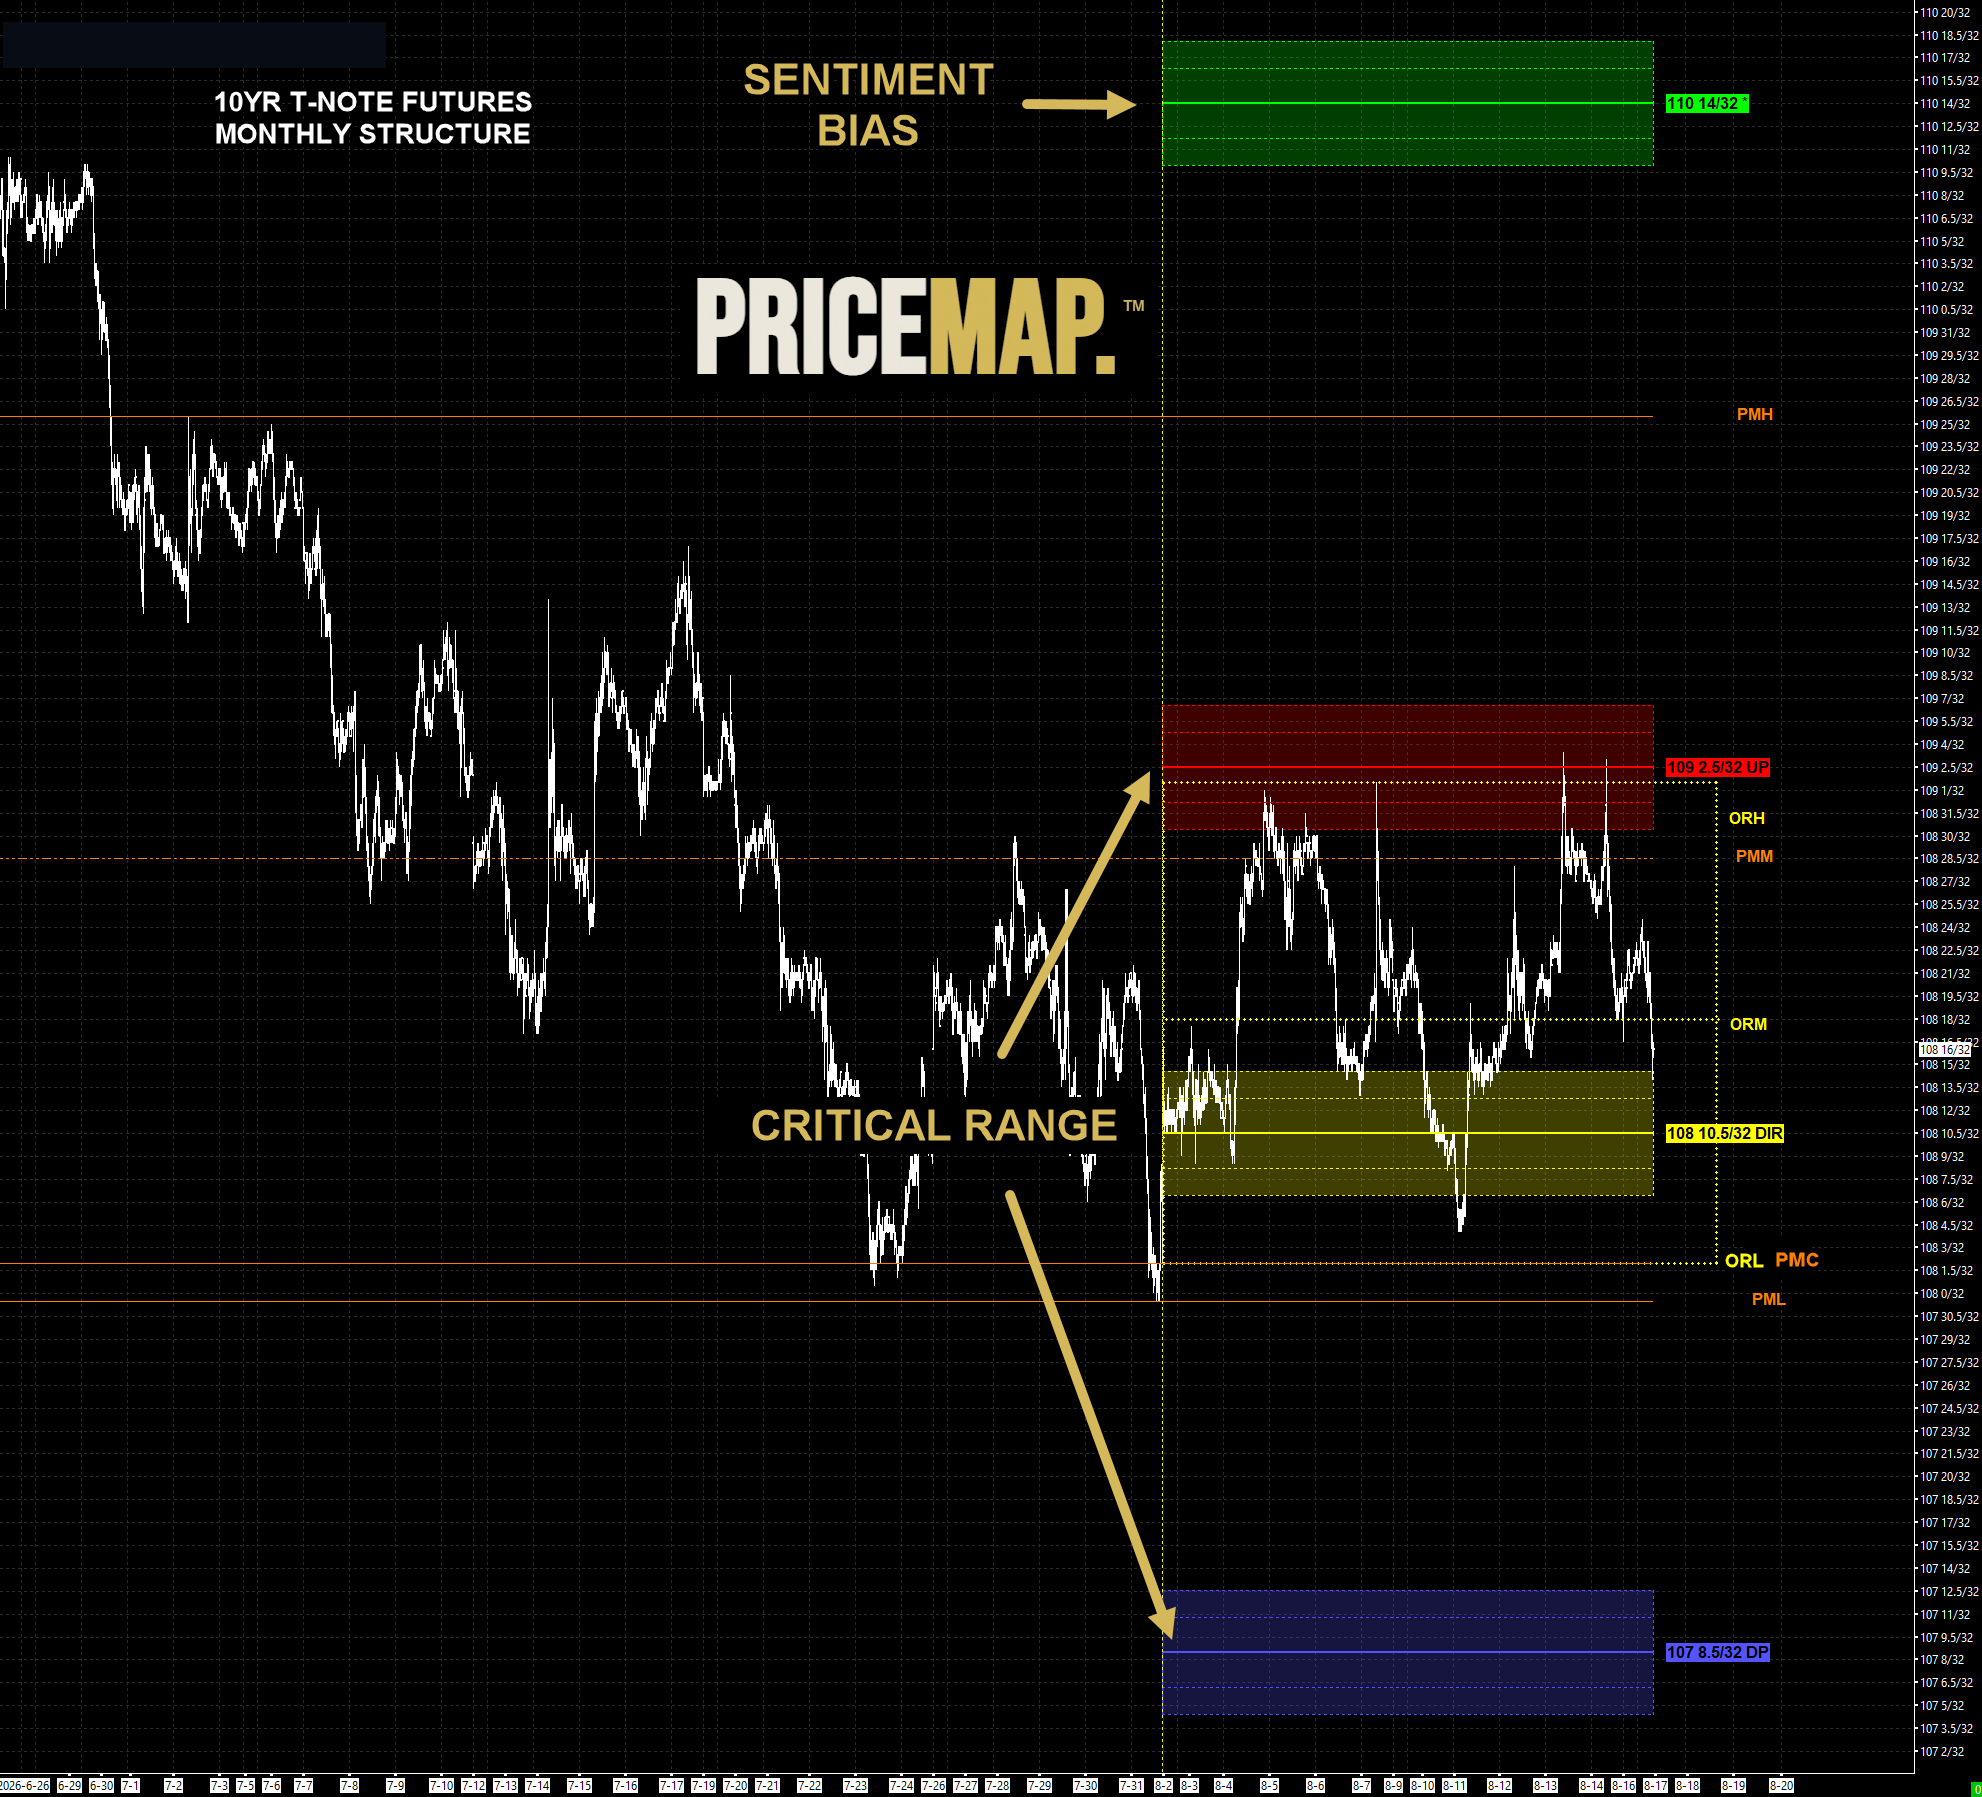
Market Structure is the PriceMap: a fixed, objective map of the levels that decide the state — computed, not drawn. It replaces the support and resistance every trader eyeballs differently with named structure that reads the same for everyone. At its core is the Critical Range — the UP and DP are the containment boundaries that hold the market state, and the DIR is the momentum pivot at the center. Inside that range price is noise: rotational, mean-reverting, quick to fake a break — the zone where most traders lose money mistaking noise for signal. Over the top, the Sentiment Bias (the R Level) sets the lean for the period. That is the foundation: it defines what is true before opinion takes over, and it marks the exact points where a state holds or turns.
That is how awareness gets built: observe price structure, frame it with the Time Frame and the Time Phase — then read all of it within Market Structure, the PriceMap. The three observable layers tell you what the market is doing. The PriceMap tells you what is true, and exactly where this market tips its hand. That is the difference between watching price and having Trade Vision.
There has never been more information — more feeds, more models, more takes. Most of it is noise, and noise is expensive under pressure. The PriceMap is the edge precisely because it tells you which information matters: what aligns with Market Structure is signal, what doesn’t is noise. Price Structure, the Time Frame and the Time Phase are ours to teach, free — the PriceMap is the foundation they are all read against, and it is what turns a flood of information into a decision. See how it is built on the PriceMap page →