Circle: The Partners Were the Signal
“Circle names BlackRock, DTCC among Arc validators as Q2 revenue hits $701 million”
Naga Avan-Nomayo, The Block · August 5, 2026
Circle named eleven founding validators for Arc, its new Layer-1 blockchain built around USDC as the native gas token. Validators are the institutions responsible for confirming transactions and securing the network — the list is BlackRock, DTCC, Visa, Mastercard, ICE, Galaxy, Global Payments, MoneyGram, SBI Group, Standard Chartered and Sumitomo. Public mainnet launches September 16.
BlackRock is expected to bring its tokenized BUIDL fund onto the network. DTCC is targeting tokenization of custodied assets on Arc starting in 2027. Read that list again: the firm that clears and settles the US securities market, the owner of the New York Stock Exchange, both card networks, and the largest asset manager in the world. Signing on as a validator is not a press release. It is an operational commitment.
Revenue and reserve income grew a modest 7% year-over-year to $701 million — unremarkable on its own. Usage is moving much faster. USDC in circulation is up 19% to $73.3 billion, and on-chain transaction volume grew faster still.
That gap is the point. Infrastructure and institutional commitment are arriving ahead of the top line, which is what an early build-out phase looks like — not a finished one. Two caveats worth holding: Arc does not yet have New York regulatory approval, and the DTCC integration targets 2027, not launch day. Real signal, not yet a finished case.
That is the fundamental backdrop. The question an operator asks next is what the market has already done with it.
It accumulated. CRCL has been basing all summer, and the move back above $72 remains the foundation underneath everything else. The stock reclaimed its prior-year close at 79.30 in August and has held above it — above the prior-year close, the year is positive; below it, negative. On a company with one full year of trading history behind it, that is the cleanest reference on the chart.
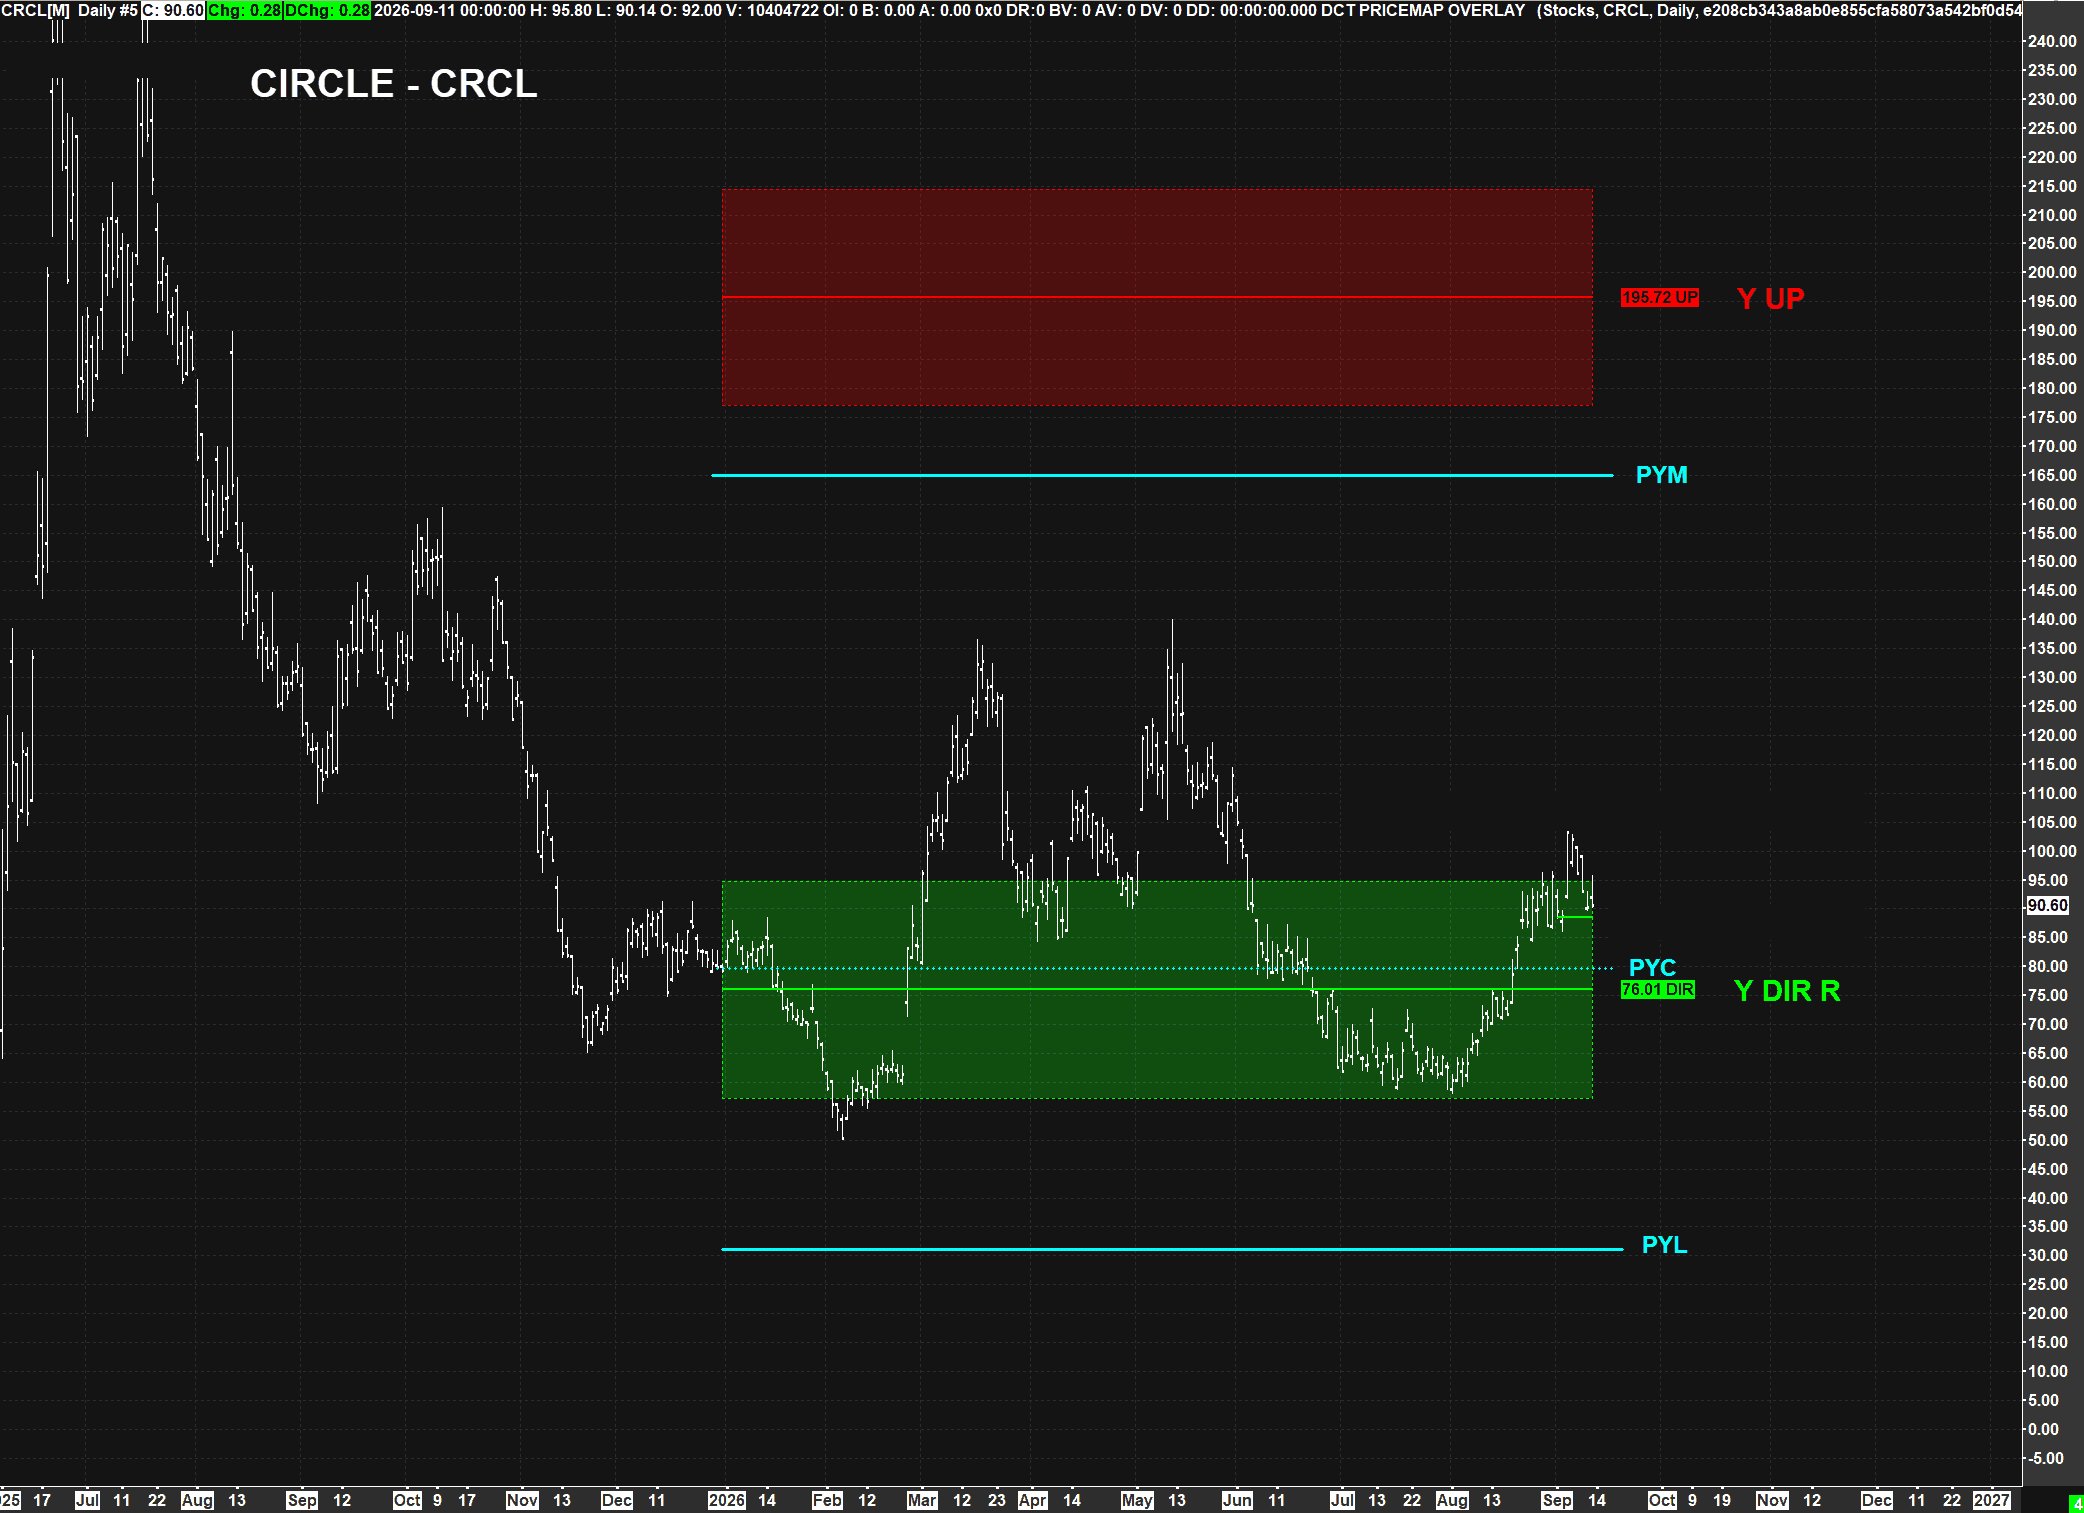
Higher and lower time frames are coming into alignment. Price is trading above the key sentiment level on the monthly, weekly and yearly maps alike — that is a real shift in momentum, not a single-week move. Each of those levels was set before its period opened and does not move when news prints. The news arrives into a map that was already there.
Right now price is trading just above the $88.43 monthly pivot. This is where the current momentum either validates or stalls.
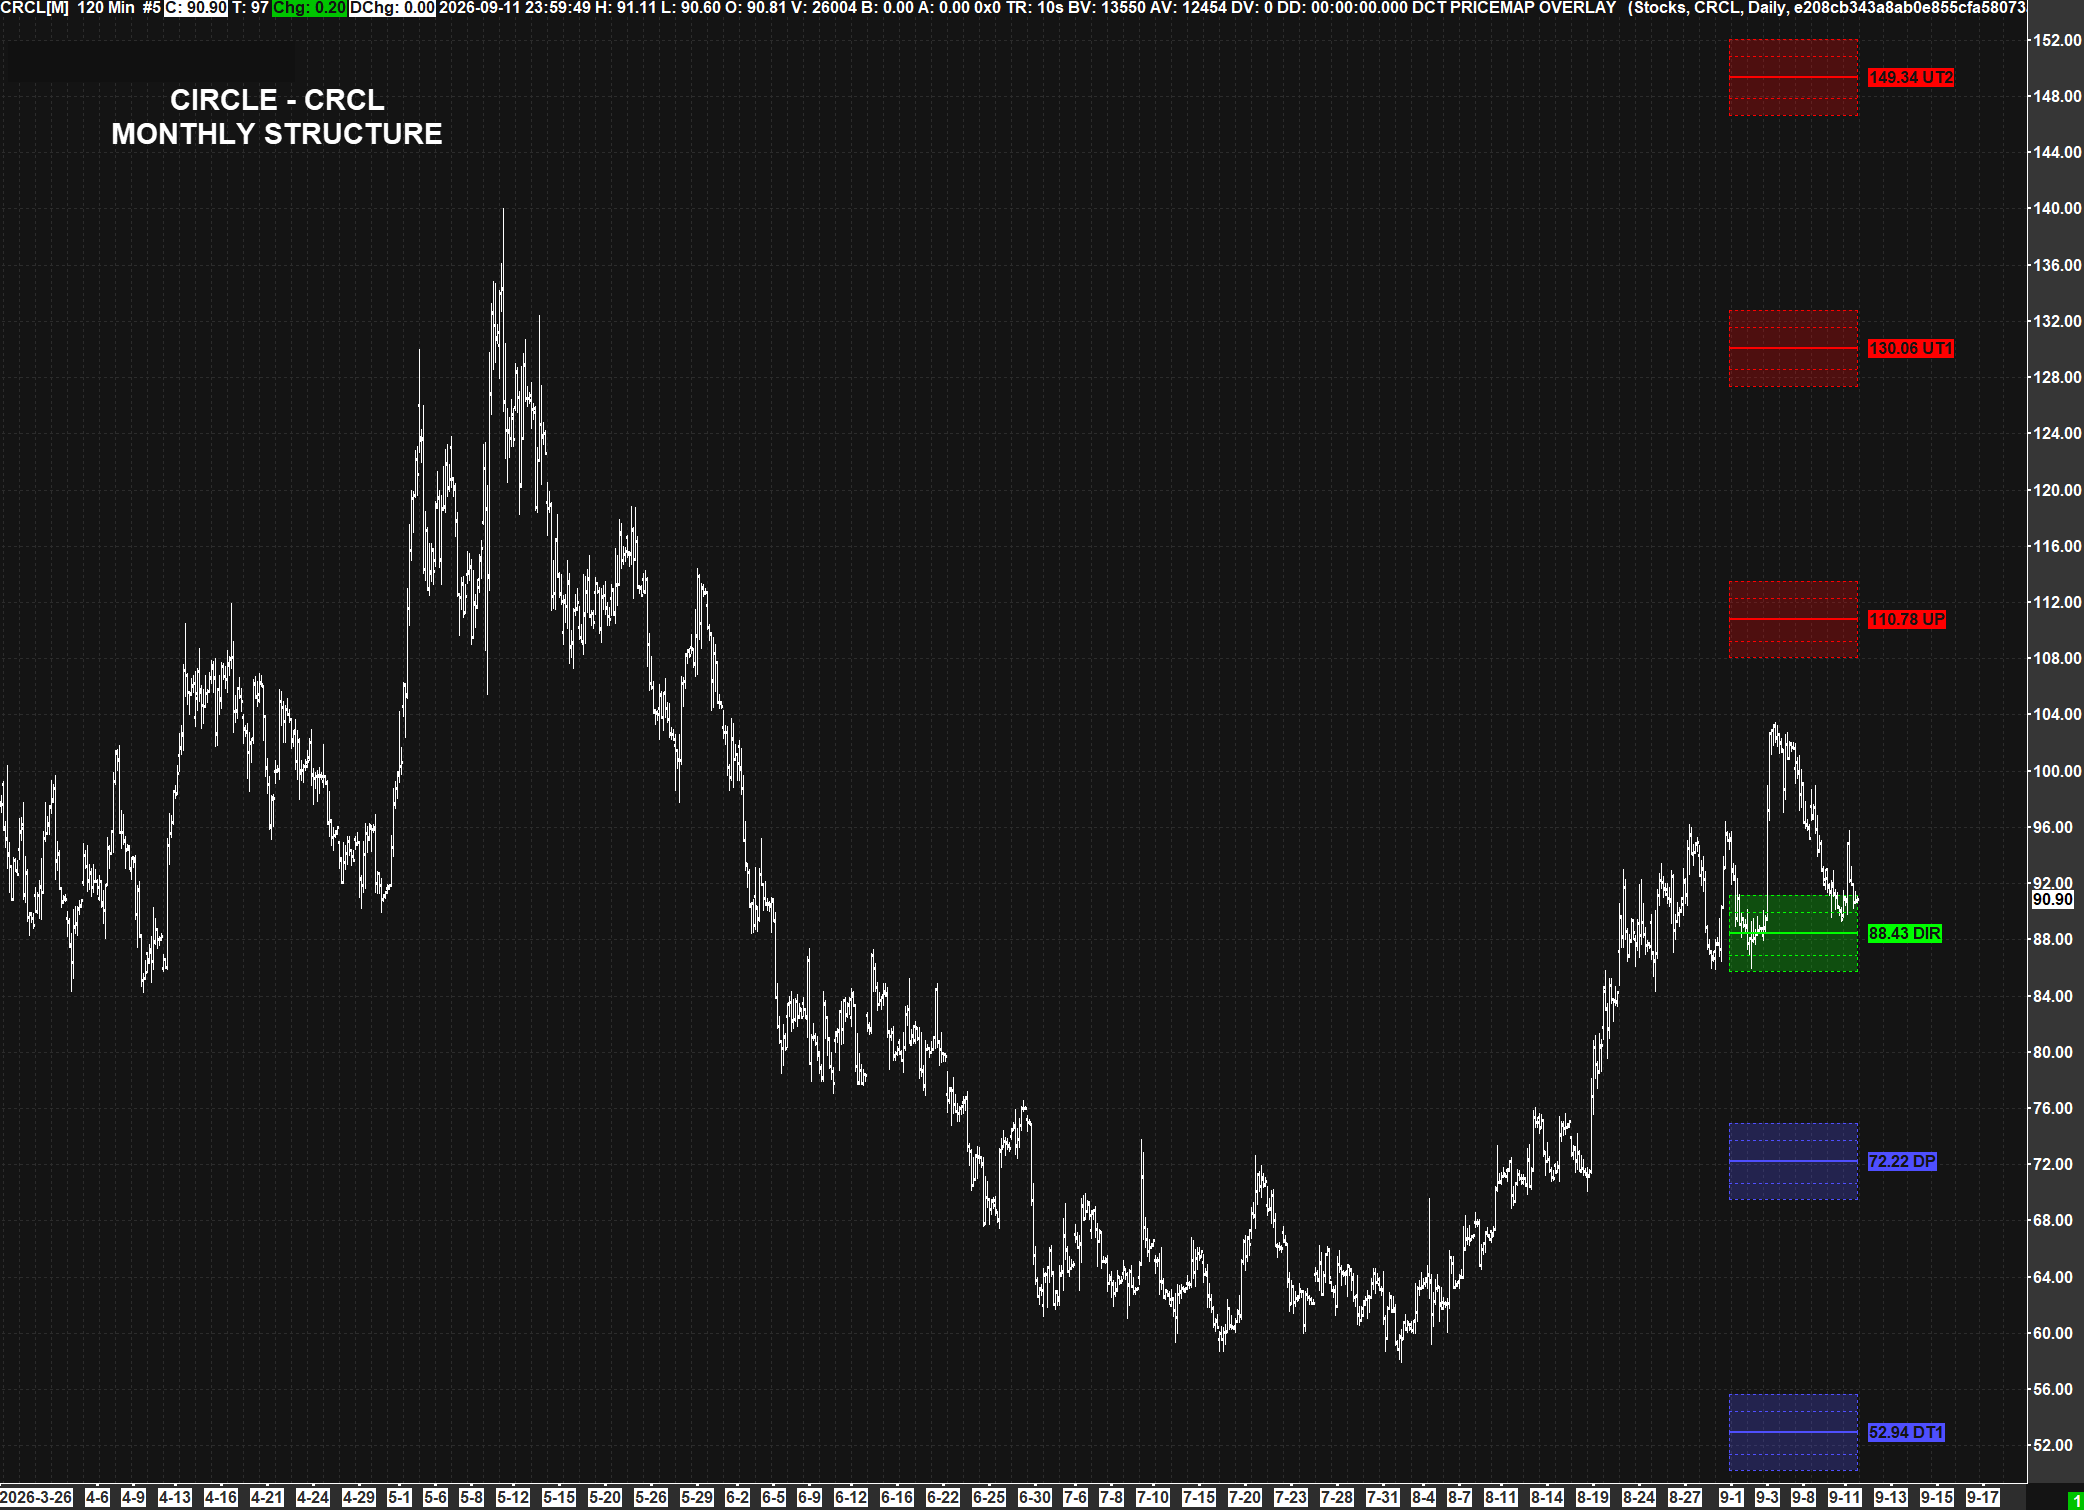
88.43 is the figure, 85.74 the lower edge of it. Together they are the foundational support this summer’s advance was built on. Below them, 84.25 is the failure point — and losing it reads lackluster rather than negative. Weakness extends rather than reverses, working back toward the $76–72 area as the market holds for a new quarterly structure reset. Four references inside a narrow band: structure that dense absorbs selling rather than accelerating it.
Hold above 88.43–85.74 and the behavior inverts. The first work is the $110.78 upside pivot. Further out the path extends toward $150, and beyond that toward $195 — if the institutional build-out and the numbers keep landing together.
Either way, this reads as a market building a base, not a coin flip.
The short-term structure is already shifting. Weekly has moved toward the bullish end of its range while the monthly and yearly frames still describe the base underneath it. That is usually the order of events: near-term structure turns first, the higher time frames confirm after.
September 16 is the point where the fundamental case and that structural shift can start moving together. Mainnet launching is mechanical — the network turns on and size builds over quarters, not days. What matters is that from here, a real build-out has somewhere to show up.
The validator list gave the reason. The market has spent the summer building the base. The map gives the prices that tell you which case is running — and it was set before any of the news arrived. If the institutional build-out is real, it shows up in price from here.
85.74 edgeThe monthly pivot and its lower boundary. The base built this summer. Price is just above it now — validate or stall.
Every market carries the same map, recalculated as each period closes. Sign up for a two-week trial and see the structure update when it happens — for Circle, and for whatever markets you are trading. Same method, unified across all asset classes.
Start the two-week trial →