Where Am I at Risk?
Jackson Hole is underway, and this morning is the one that matters: Kevin Warsh gives his first major speech as Fed Chair at 10:00 a.m. New York time. The backdrop isn’t quiet. The FOMC held in July, but the committee is divided — three voting members dissented for a hike, and non-voters have leaned tighter since. Long-end yields have pushed higher on heavier issuance, competition for funds, and open questions about Warsh’s resolve on inflation — and Treasury Secretary Bessent answered with plans to buy back longer-dated debt. Futures put the odds of a September hike near 36%.
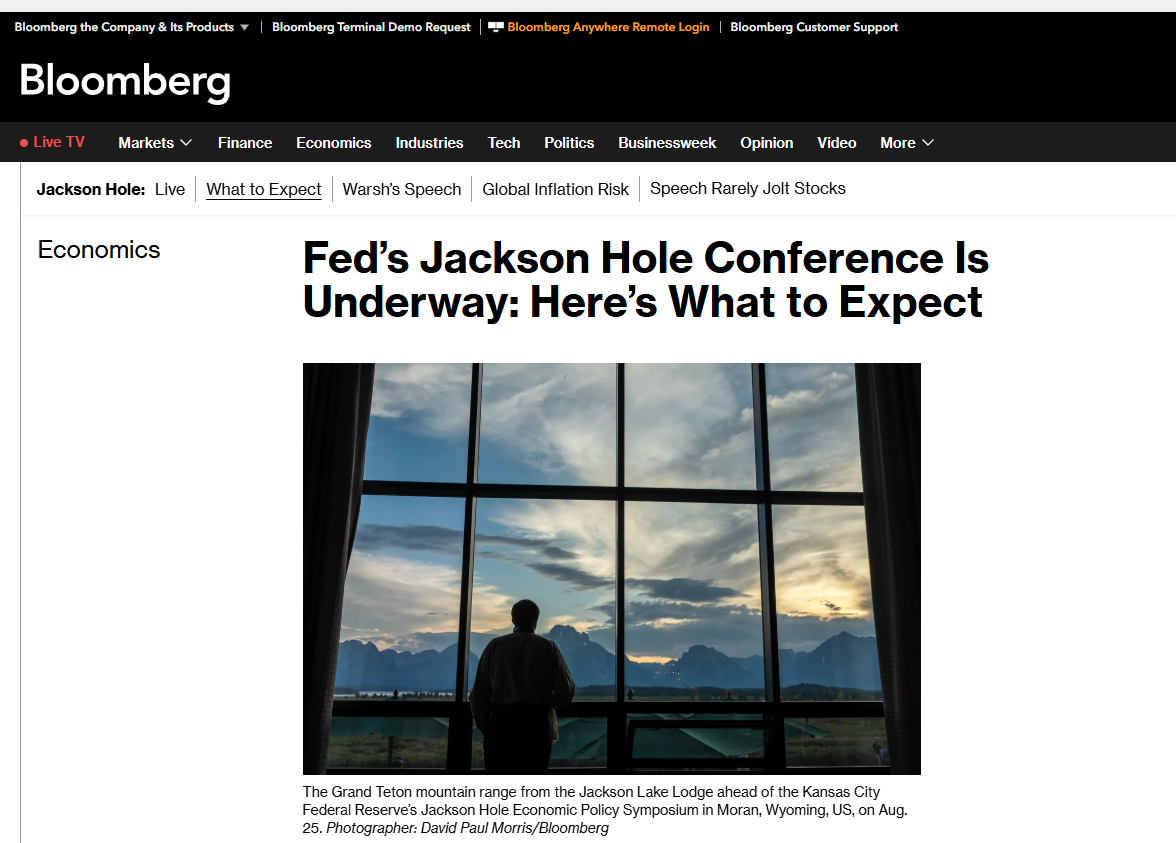
In other words: a binary event, into a divided Fed, with the long end already under pressure. Two questions before I take that on. Where am I at risk? And what can happen — where can it go? I answer both through structure first, then bring in Navigator to read the whole complex at once.
Put the four contracts on the same PriceMap and one posture jumps off the screen: the entire curve is coiled above its Monthly DIR, capped at its Daily/Weekly R, and sitting under its Monthly UP. The complex is pressed against near-term resistance into a binary event — and if you are positioned long, leaning for lower yields, you are exposed at resistance. Same risk, all four maturities.
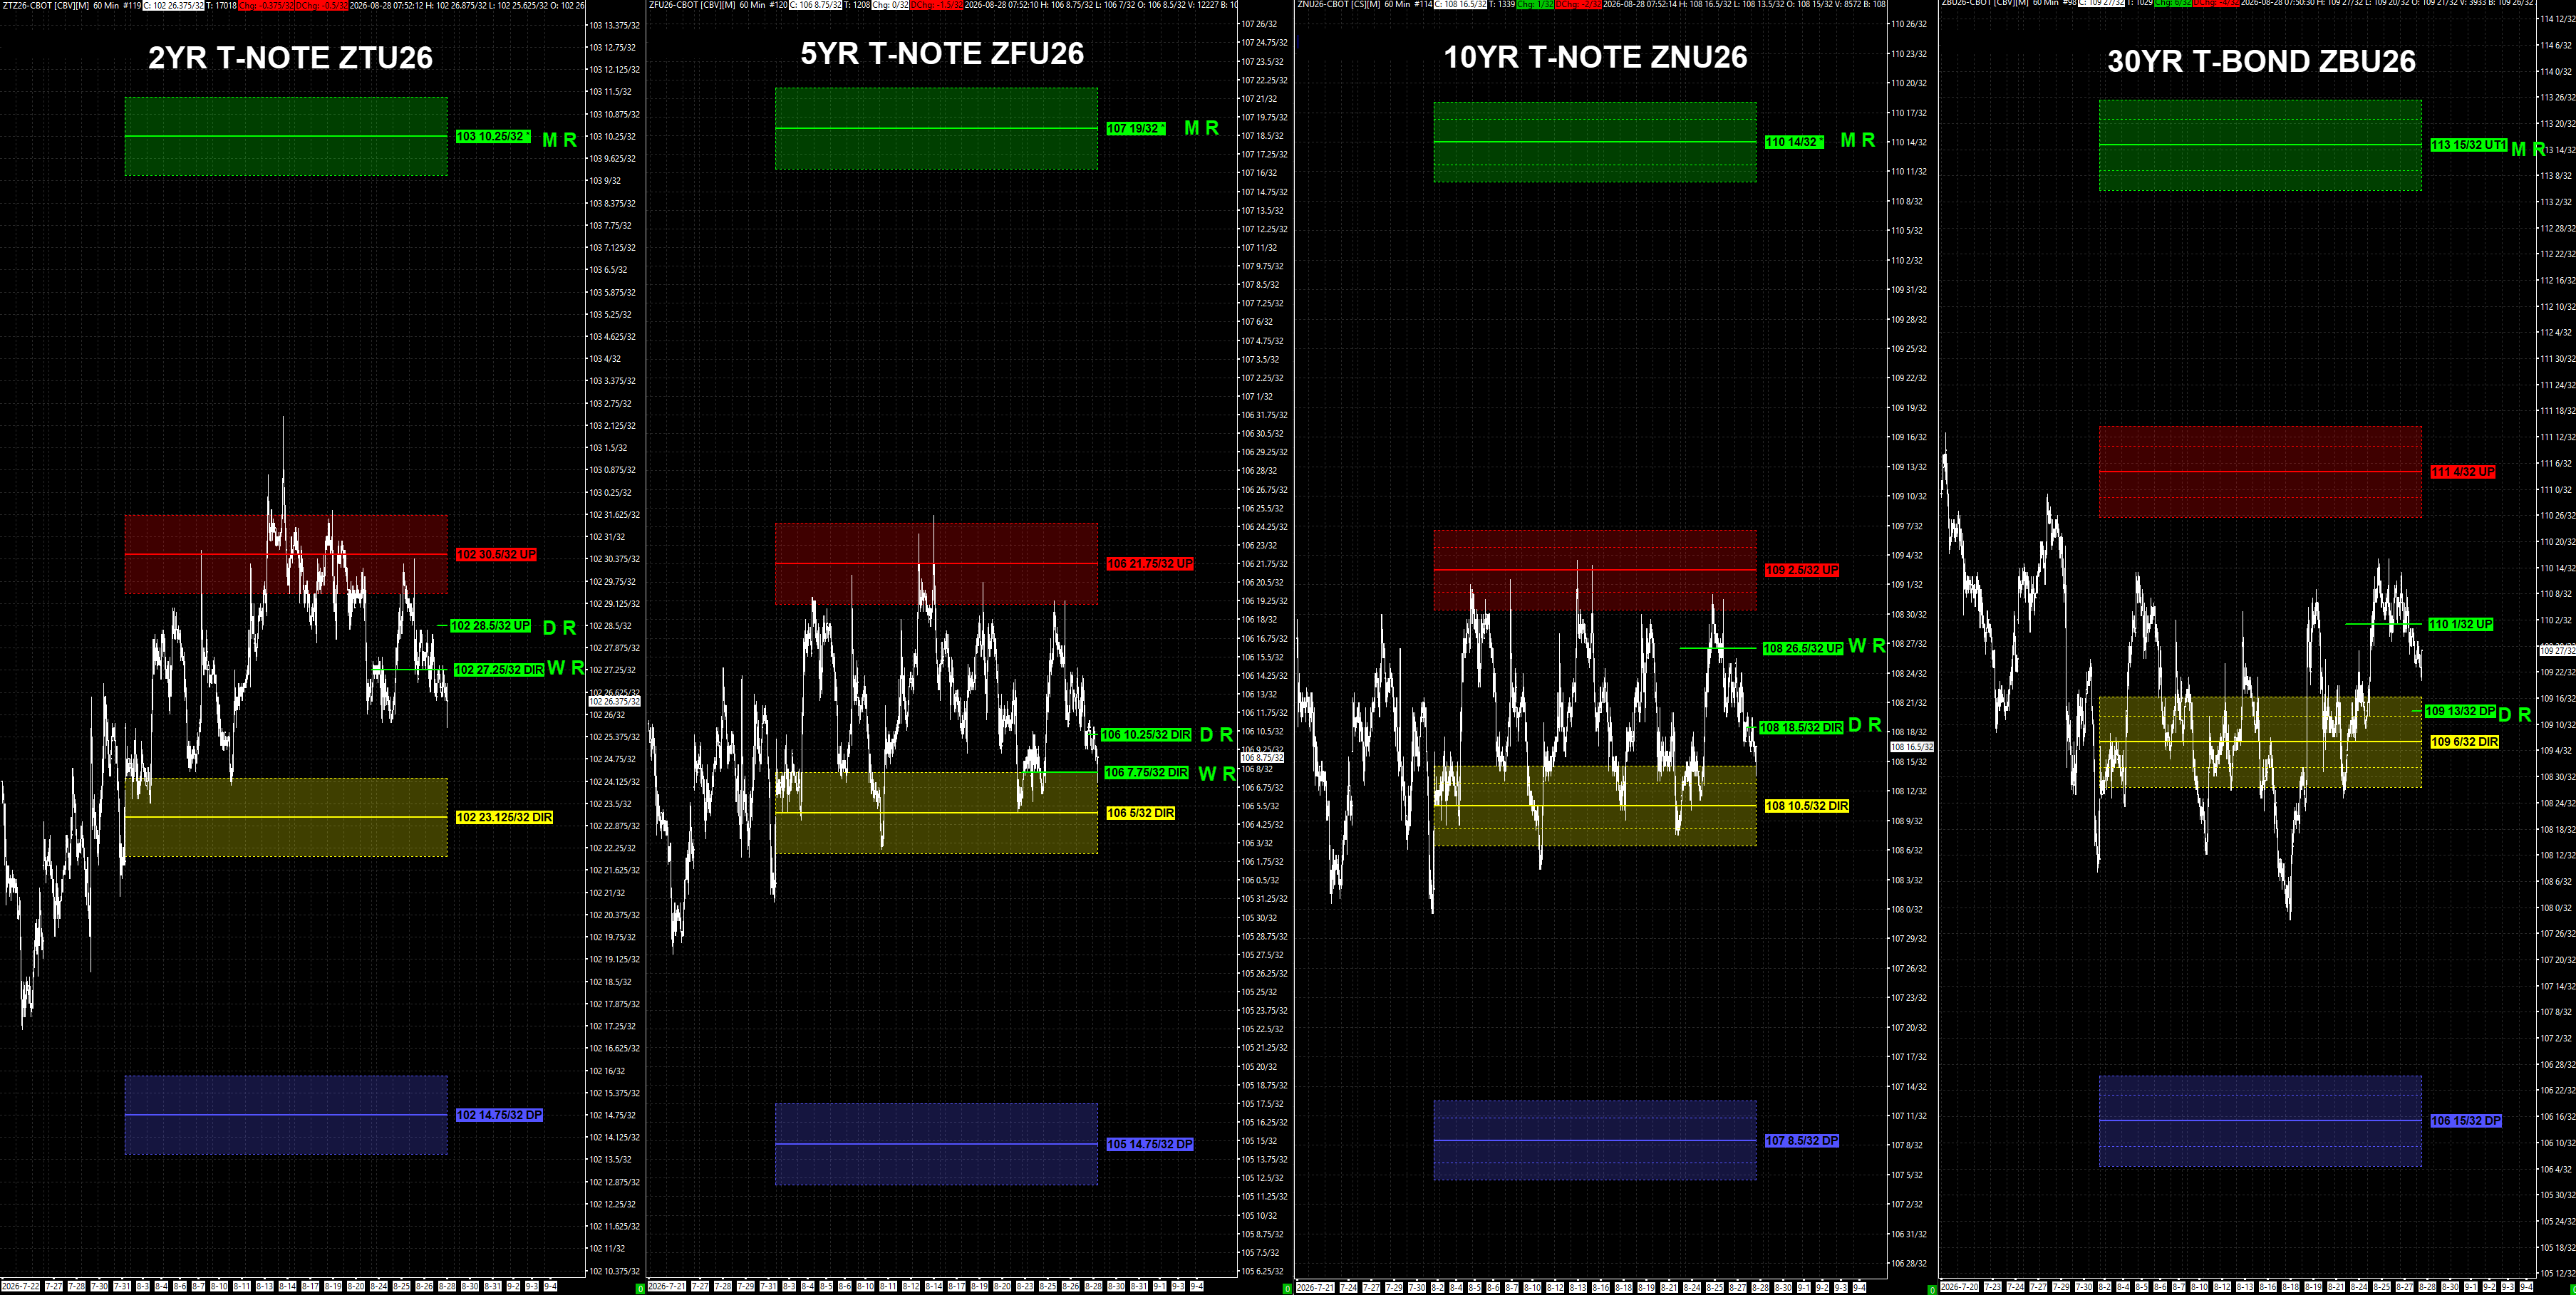
Because price is at the R levels across the board, the reaction is sharp either way. If Warsh reinforces the inflation fight — or endorses higher yields — the complex rejects these R ceilings and sells off, yields up. If he leans dovish, or backs Bessent’s long-end containment, it breaks up through the R levels, yields down. The R levels are the pivot; reject or accept decides the day. I don’t need to predict the speech to know that — and I don’t need to guess the destination either. The map already carries it: below the DIRs the structure opens lower, above the R’s it points at the Monthly UPs.
There is a front-to-back split. ZT (2-Year) is the least event-sensitive — it keys off the short-end, inflation-credibility message. ZB (30-Year) is the most — it keys off the long-end, Bessent-containment message. So the curve can split: a hawkish-inflation tone pressures the front while a supportive nod to the long end lifts the back. Watch whether they move together or diverge — the divergence itself is the message.
The leader is ZB, the 30-Year — the maturity Bessent intervened on, the one Warsh’s credibility test hits hardest, with the most room to run and the most event sensitivity. The single line I’m watching: ZB’s Daily R at 110-01.5. Reject it and the long-end selloff resumes — yields higher, the curve follows; the map opens the downside toward the 109-06 DIR, then the 106-15 Monthly DP. Accept above it and Warsh gave the long end relief — the 111-04 UP is the next structure overhead, then the 113-15 Monthly R — and I’d expect ZN to confirm through its Weekly R at 108-26.5.
Everything above comes off the structure — the PriceMap, the market intelligence we publish. So I put it to Navigator for the objective read. One question: “What are my risks for the keynote today across ZT, ZF, ZN, ZB, and which is the leader and one to watch?” Here is what came back.
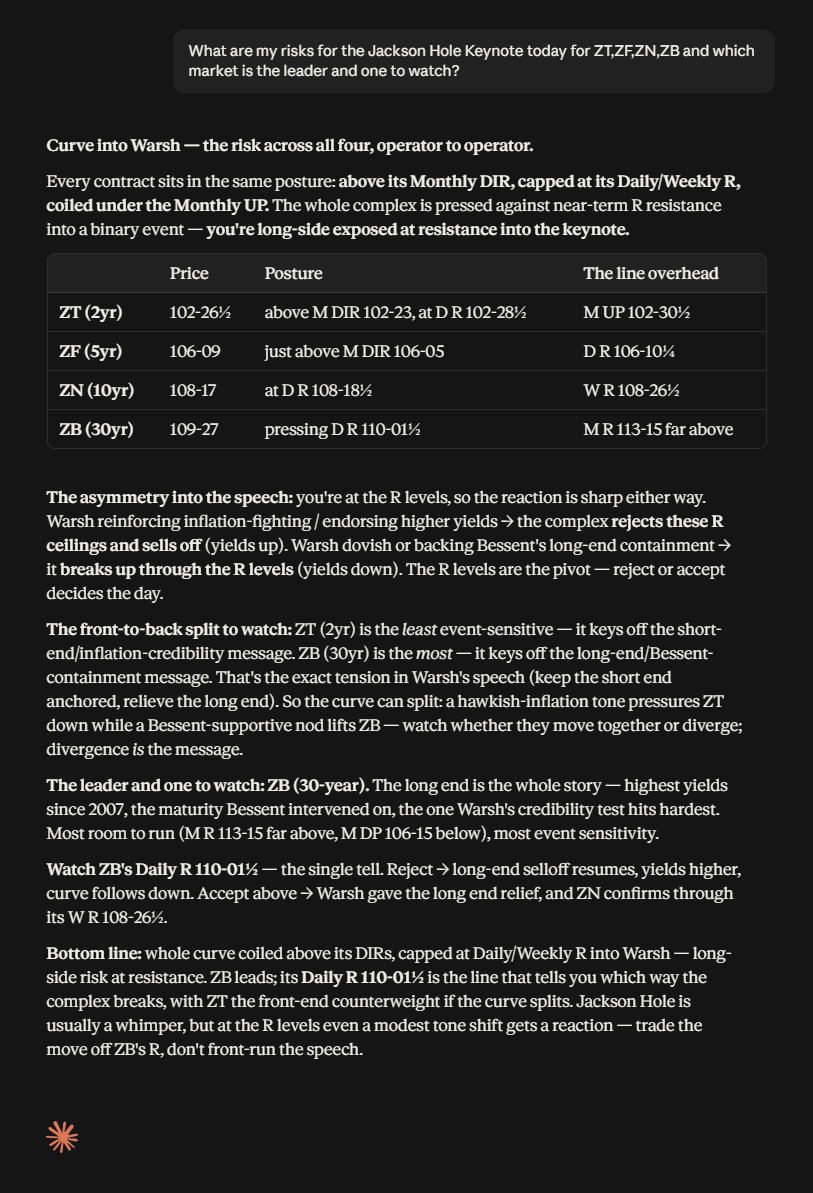
Here is the relationship between the two things we publish. The PriceMap is the market intelligence — the structural overlay we have put out every day for forty years, the data an operator studies to analyze, build a strategy, and make decisions. Navigator is the decision support to it: it knows the whole stack, and it carries the read of a forty-year operator’s experience. Ask it, and it hands you the objective read — a benchmark to hold against whatever heuristic bias you walked in with. It doesn’t make the call. It keeps the call honest. You stay the operator.
The whole curve is coiled above its DIRs and capped at its Daily/Weekly R into Warsh — long-side risk, at resistance. ZB leads; its Daily R at 110-01.5 is the line that tells you which way the complex breaks, with ZT the front-end counterweight if the curve splits. Jackson Hole is usually a whimper, but standing right at the R levels, even a modest shift in tone gets a reaction.
The process isn’t to guess the speech. It’s to know exactly where you are at risk, mark the level that decides it, and let price tell you.
The PriceMap is the fixed structure the read is built on — the same overlay on every contract and time frame. Navigator, our AI agent, reads the whole complex against it in one pass, so you see where the risk is and what can happen before the event, not after. See the Navigator → or how the map is built on the PriceMap page →