Setup
The PriceMap integration for Sierra Chart has two parts: a custom study that draws the levels on your chart, and the DCT PriceMap API that feeds them — no local CSV files. Here's the full written walkthrough; if you'd rather watch, the video is at the bottom.
Two Sierra Chart custom studies (.dll, 64-bit) · place both in C:\SierraChart\Data · connect with your API key.
-
Connect to the API
Log in to MKT.TRADE and generate a new API key under Accounts → API Keys. Then download the studies above and place both .dll files in your C:\SierraChart\Data folder — this exact path; the directory name is not flexible.
-
Add the custom study
In Sierra Chart, go to Analysis → Studies → Add Custom Study, find DCT PriceMap Overlay, and click Add.
-
Add PriceMap to your chart
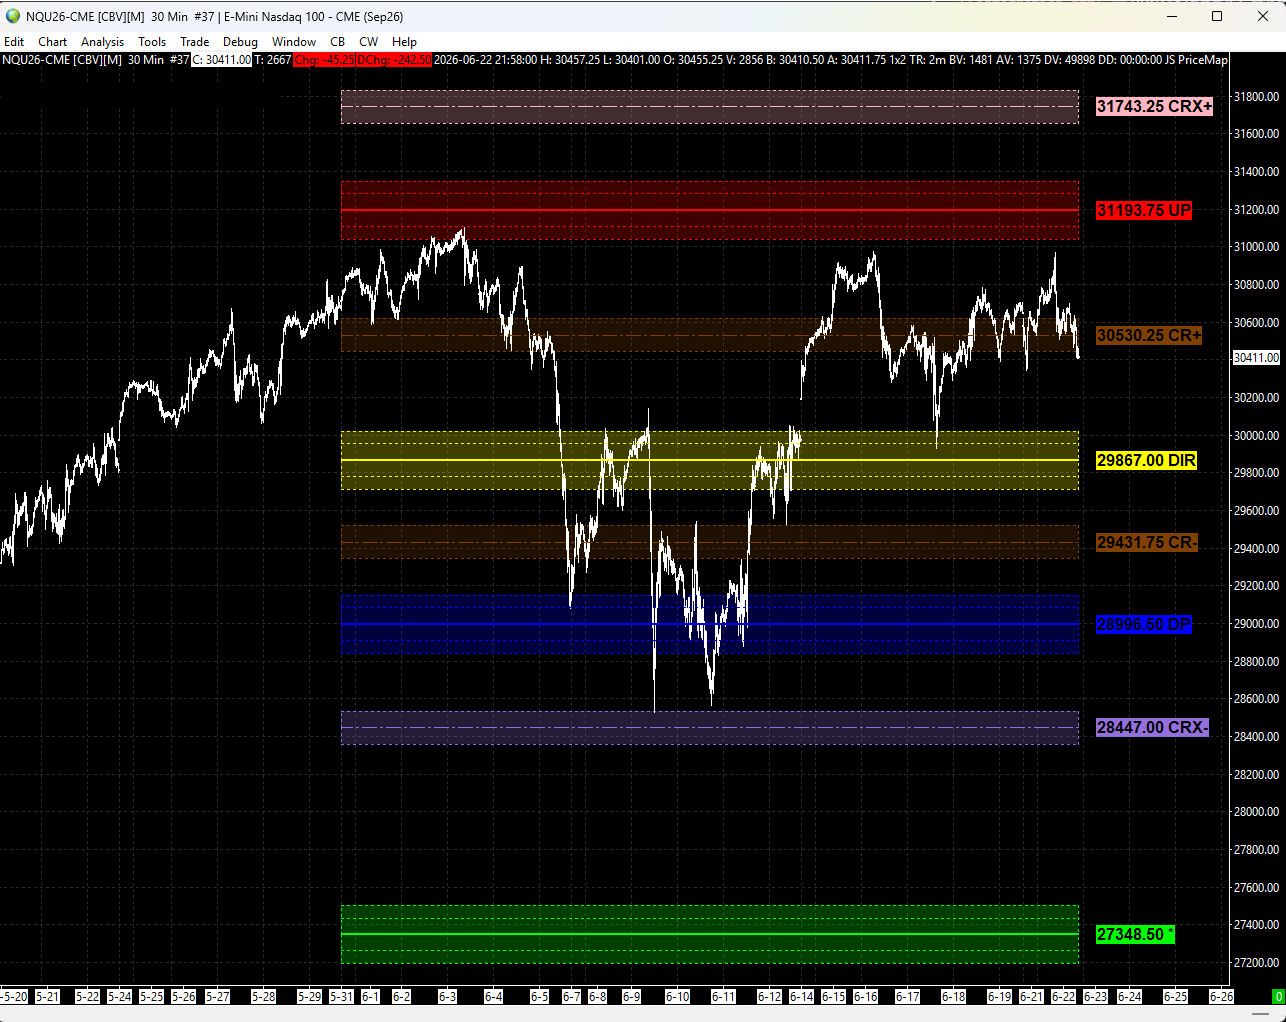
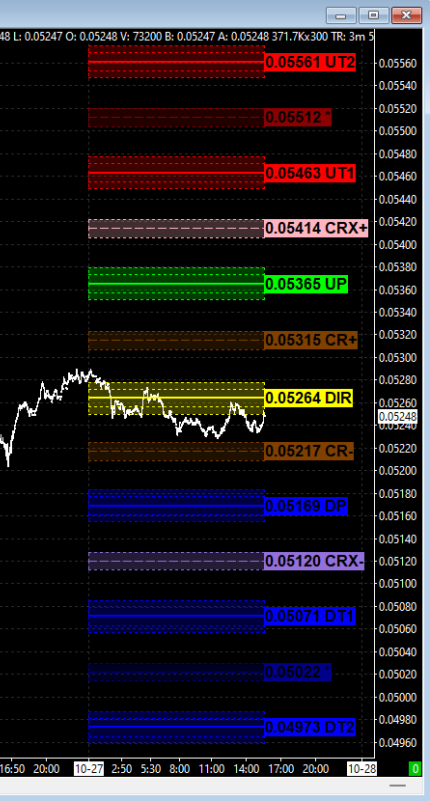
Set the asset class, symbol, and time frame. Enter the DCT symbol — for example crypto BINANCE.BTCUSDP, or futures TY for the 10-year T-Note — and choose Daily, Weekly, Monthly, Quarterly, or Yearly. Paste your API key (copy it directly from the site and keep it private), then Apply → OK. Your PriceMap levels render on the chart.
-
Layer multiple time frames
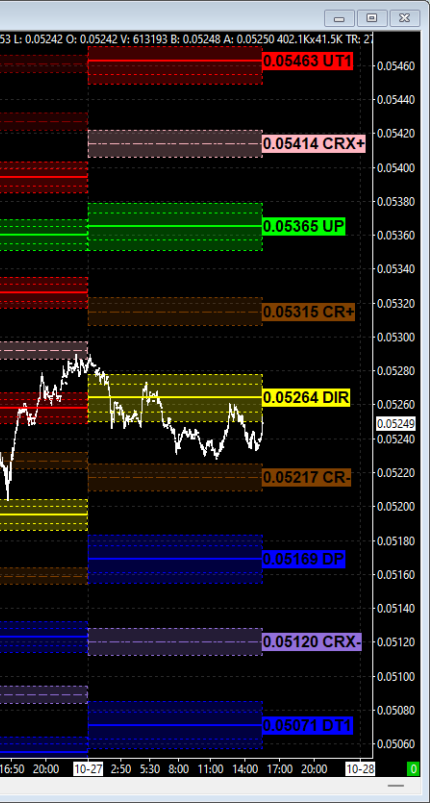
To see Daily, Weekly, and Monthly levels together, duplicate the chart via Chart → Duplicate Chart and set each copy to a different time frame.
Display features. Right-click the chart to switch views: R-level only, Critical Range only, Critical Range with minor levels, Critical Range with AD & VAR metric boundaries, Full PriceMap with metric boundaries, or per-period view.
Troubleshooting. If levels don't appear, confirm your internet and API-source connection, and that both .dll files are in C:\SierraChart\Data.
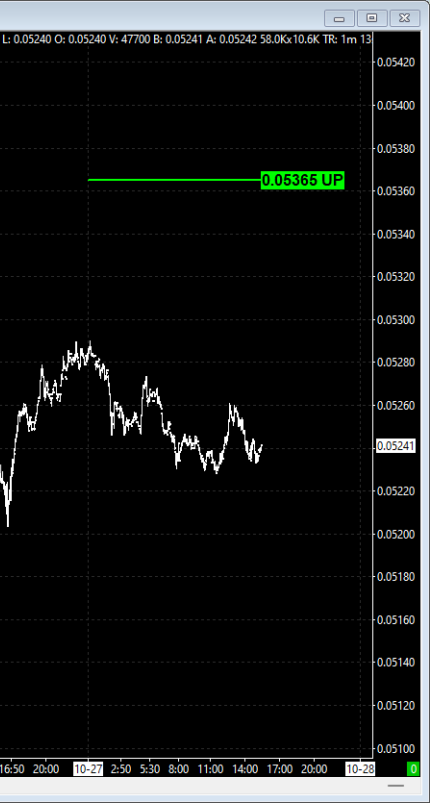
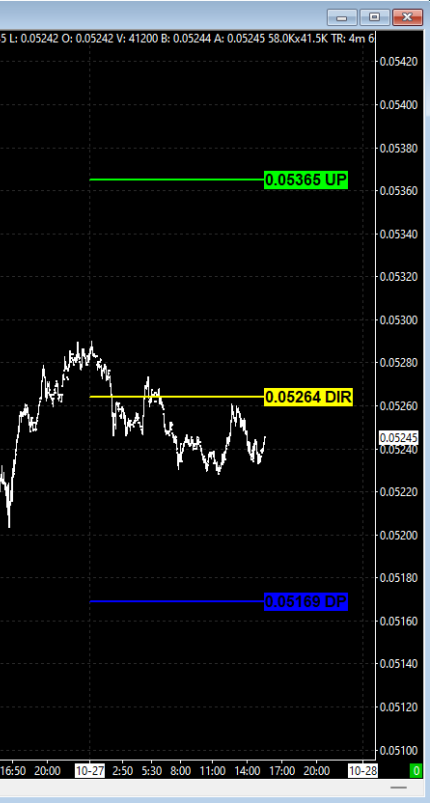
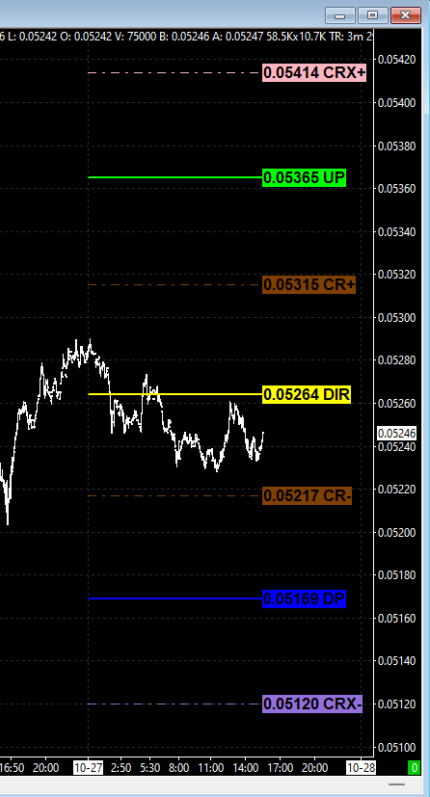
Prefer to watch? The setup video covers the same steps.