10-Year T-Note: On the Fence at the Monthly Pivot
Next: The Opening Range Is Set →
The rate picture is genuinely undecided, which is exactly why it is worth following. The FOMC under Chair Kevin Warsh held the funds rate at 3.50–3.75% at the July 28–29 meeting — the fifth straight hold — but on a divided 9–3 vote, with three members dissenting for a hike. Core PCE sits at 3.3% (headline near 3.7%), still well above the 2% goal, and energy prices are held up by the Middle East conflict — a supply shock the Fed named directly.
Here is the tension. The administration is pushing publicly for lower rates. But inflation is sticky, oil is a live supply shock, three policymakers already want to tighten, and the market has repriced: futures now lean toward a September hike as the more likely outcome, not a cut. The 10-Year cash yield has climbed from under 4.4% in late June to roughly 4.68–4.69%, tagging multi-month highs near 4.74–4.75% along the way.
A quick orientation, since we trade the contract: the 10-Year Note futures — ZN | TY at the CBOT — move inverse to yield. When the note price falls, the yield rises; when it rallies, the yield eases. We quote price first and put the yield right alongside it, the whole way down.
Think of it as a rubber band. When policy is leaned against the fundamentals — held lower than inflation and supply pressure would otherwise dictate — the tension does not vanish. It stores. Nobody knows the day it releases, and the honest other side is real too: some houses (Goldman among them) still project holds straight through 2026, and if oil and inflation cool the range simply persists. We do not predict the snap. We map the structure, and let price tell us which way the tension resolves.
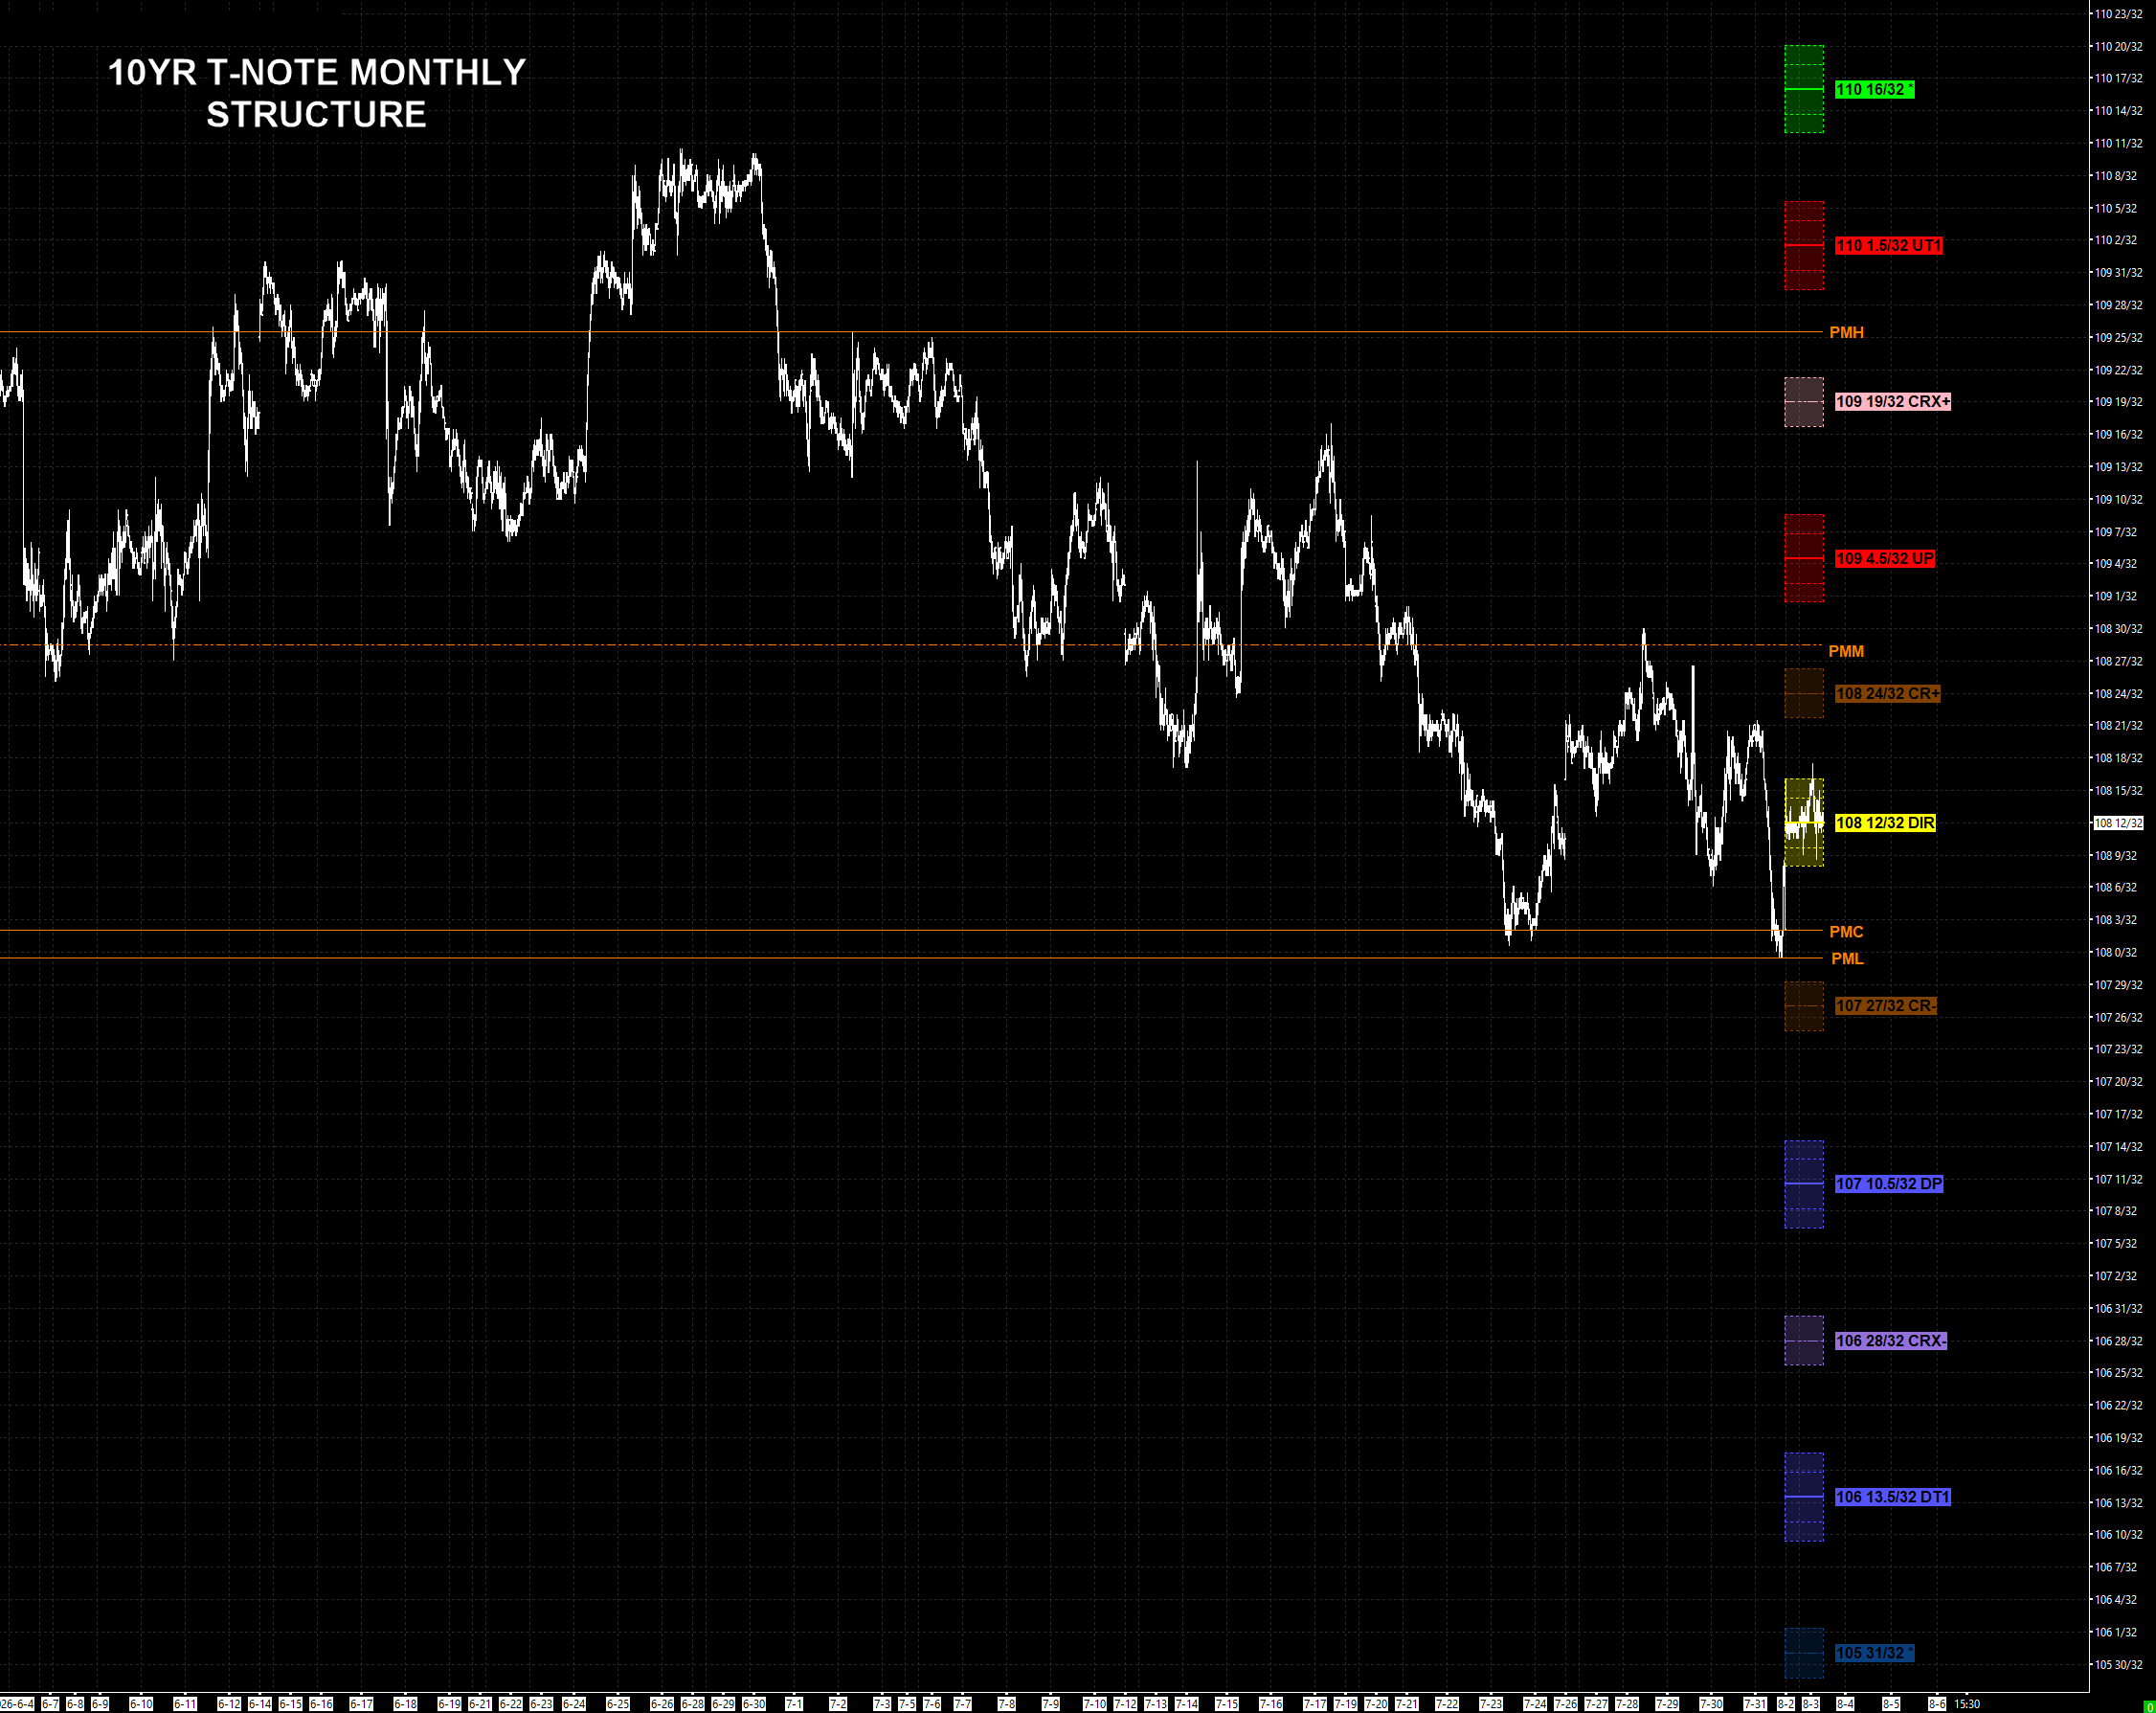
We quote in points and 32nds — 108-12 means 108 and 12/32 — and pair each level with its approximate yield. The whole downside of this map is the higher-yield case; the upside is the lower-yield case. (Yields approximate: the futures-to-yield tie runs through the cheapest-to-deliver note, so treat them as orientation, not the cash tick.)
| ZN | TY level | Price | ≈ 10-Yr yield |
|---|---|---|
| R — Sentiment Bias | 110-16 | ≈ 4.36% |
| UT1 | 110-01.5 | ≈ 4.43% |
| UP — upside pivot | 109-04.5 | ≈ 4.57% |
| PMM — prior-month midpoint | 108-28.5 | ≈ 4.60% |
| DIR — the monthly pivot | 108-12 | ≈ 4.68% (here now) |
| PMC / PML — prior-month close / low | 108-03 / 108-00 | ≈ 4.72–4.74% |
| CR- — lower validation | 107-27 | ≈ 4.76% |
| DP — downside pivot | 107-10.5 | ≈ 4.84% |
| CRX- — event flush | 106-28 | ≈ 4.90% |
| Q3 lower extreme | 104-05 | ≈ 5.30% |
So when the read below talks about price pressing lower, read it as yield pressing higher — the rubber-band case. A rally back up the map is yield easing back toward the mid-4.5s and lower.
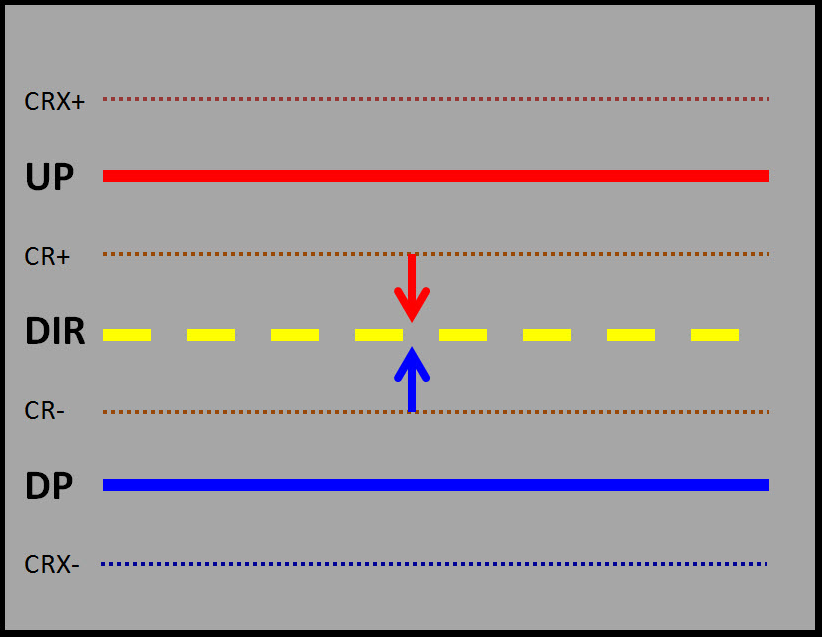
The Critical Range is the neutral zone of the structure — the band between the UP (upper boundary) and the DP (downside pivot), with the DIR at its center. Inside it, price is rotational, choppy, mean-reverting and fade-friendly, with a high false-breakout rate. It is where most traders lose money, because inside the range they mistake noise for signal. A CR Rotational theme simply says: expect price to rotate between the edges rather than trend — fade the boundaries, respect the middle, and keep segments small.
Those edges have names: the CR+ and CR-, the upper and lower validation levels that frame the rotation around the DIR. In non-trending, coiling action the CR+ acts as resistance and the CR- as support — classic rotational trading fades the CR+, fades the CR-, and respects the DIR in the middle. When those boundaries start to tighten, it is telling you one of two things: a digestion trade winding down, or a transitional breakout building.
August makes that lean the base case. Summer liquidity is thin and desks are light; the market often adopts a “wait til after Labor Day” posture and refuses to commit to a real move until the calendar turns. Thin, two-sided, stop-and-go rotation inside the range — that is the CR Rotational theme, and it fits the season.
The Monthly structure carries the prior month's footprints: PMH / PML / PMC / PMM — previous-month High, Low, Close and Midpoint. They are a 30-day institutional posture: above the PMC is positive monthly performance, above the PMM is a trending lean, below the PMM is corrective.
This month opened with the PML (108-00) and PMC (108-03) stacked in a tight range — a close pinned right at the prior low. That compression is a coil: it typically signals either a quick extension lower (following through on July's end-of-month weakness) or a snap back to the PMM at 108-28.5. Right now the snap-back is the one playing out.
The 108-12 DIR — roughly a 4.68% yield — is the Directional Pivot for the month, if not the quarter. It is the line that defines the whole Q3 lean, and price is sitting right on it. The bounce off the tight PML/PMC coil is carrying toward the PMM at 108-28.5, and that lines up with the CR+ upper metric boundary at 108-26.5 and the impulse reaction — the lower high — at 108-30.
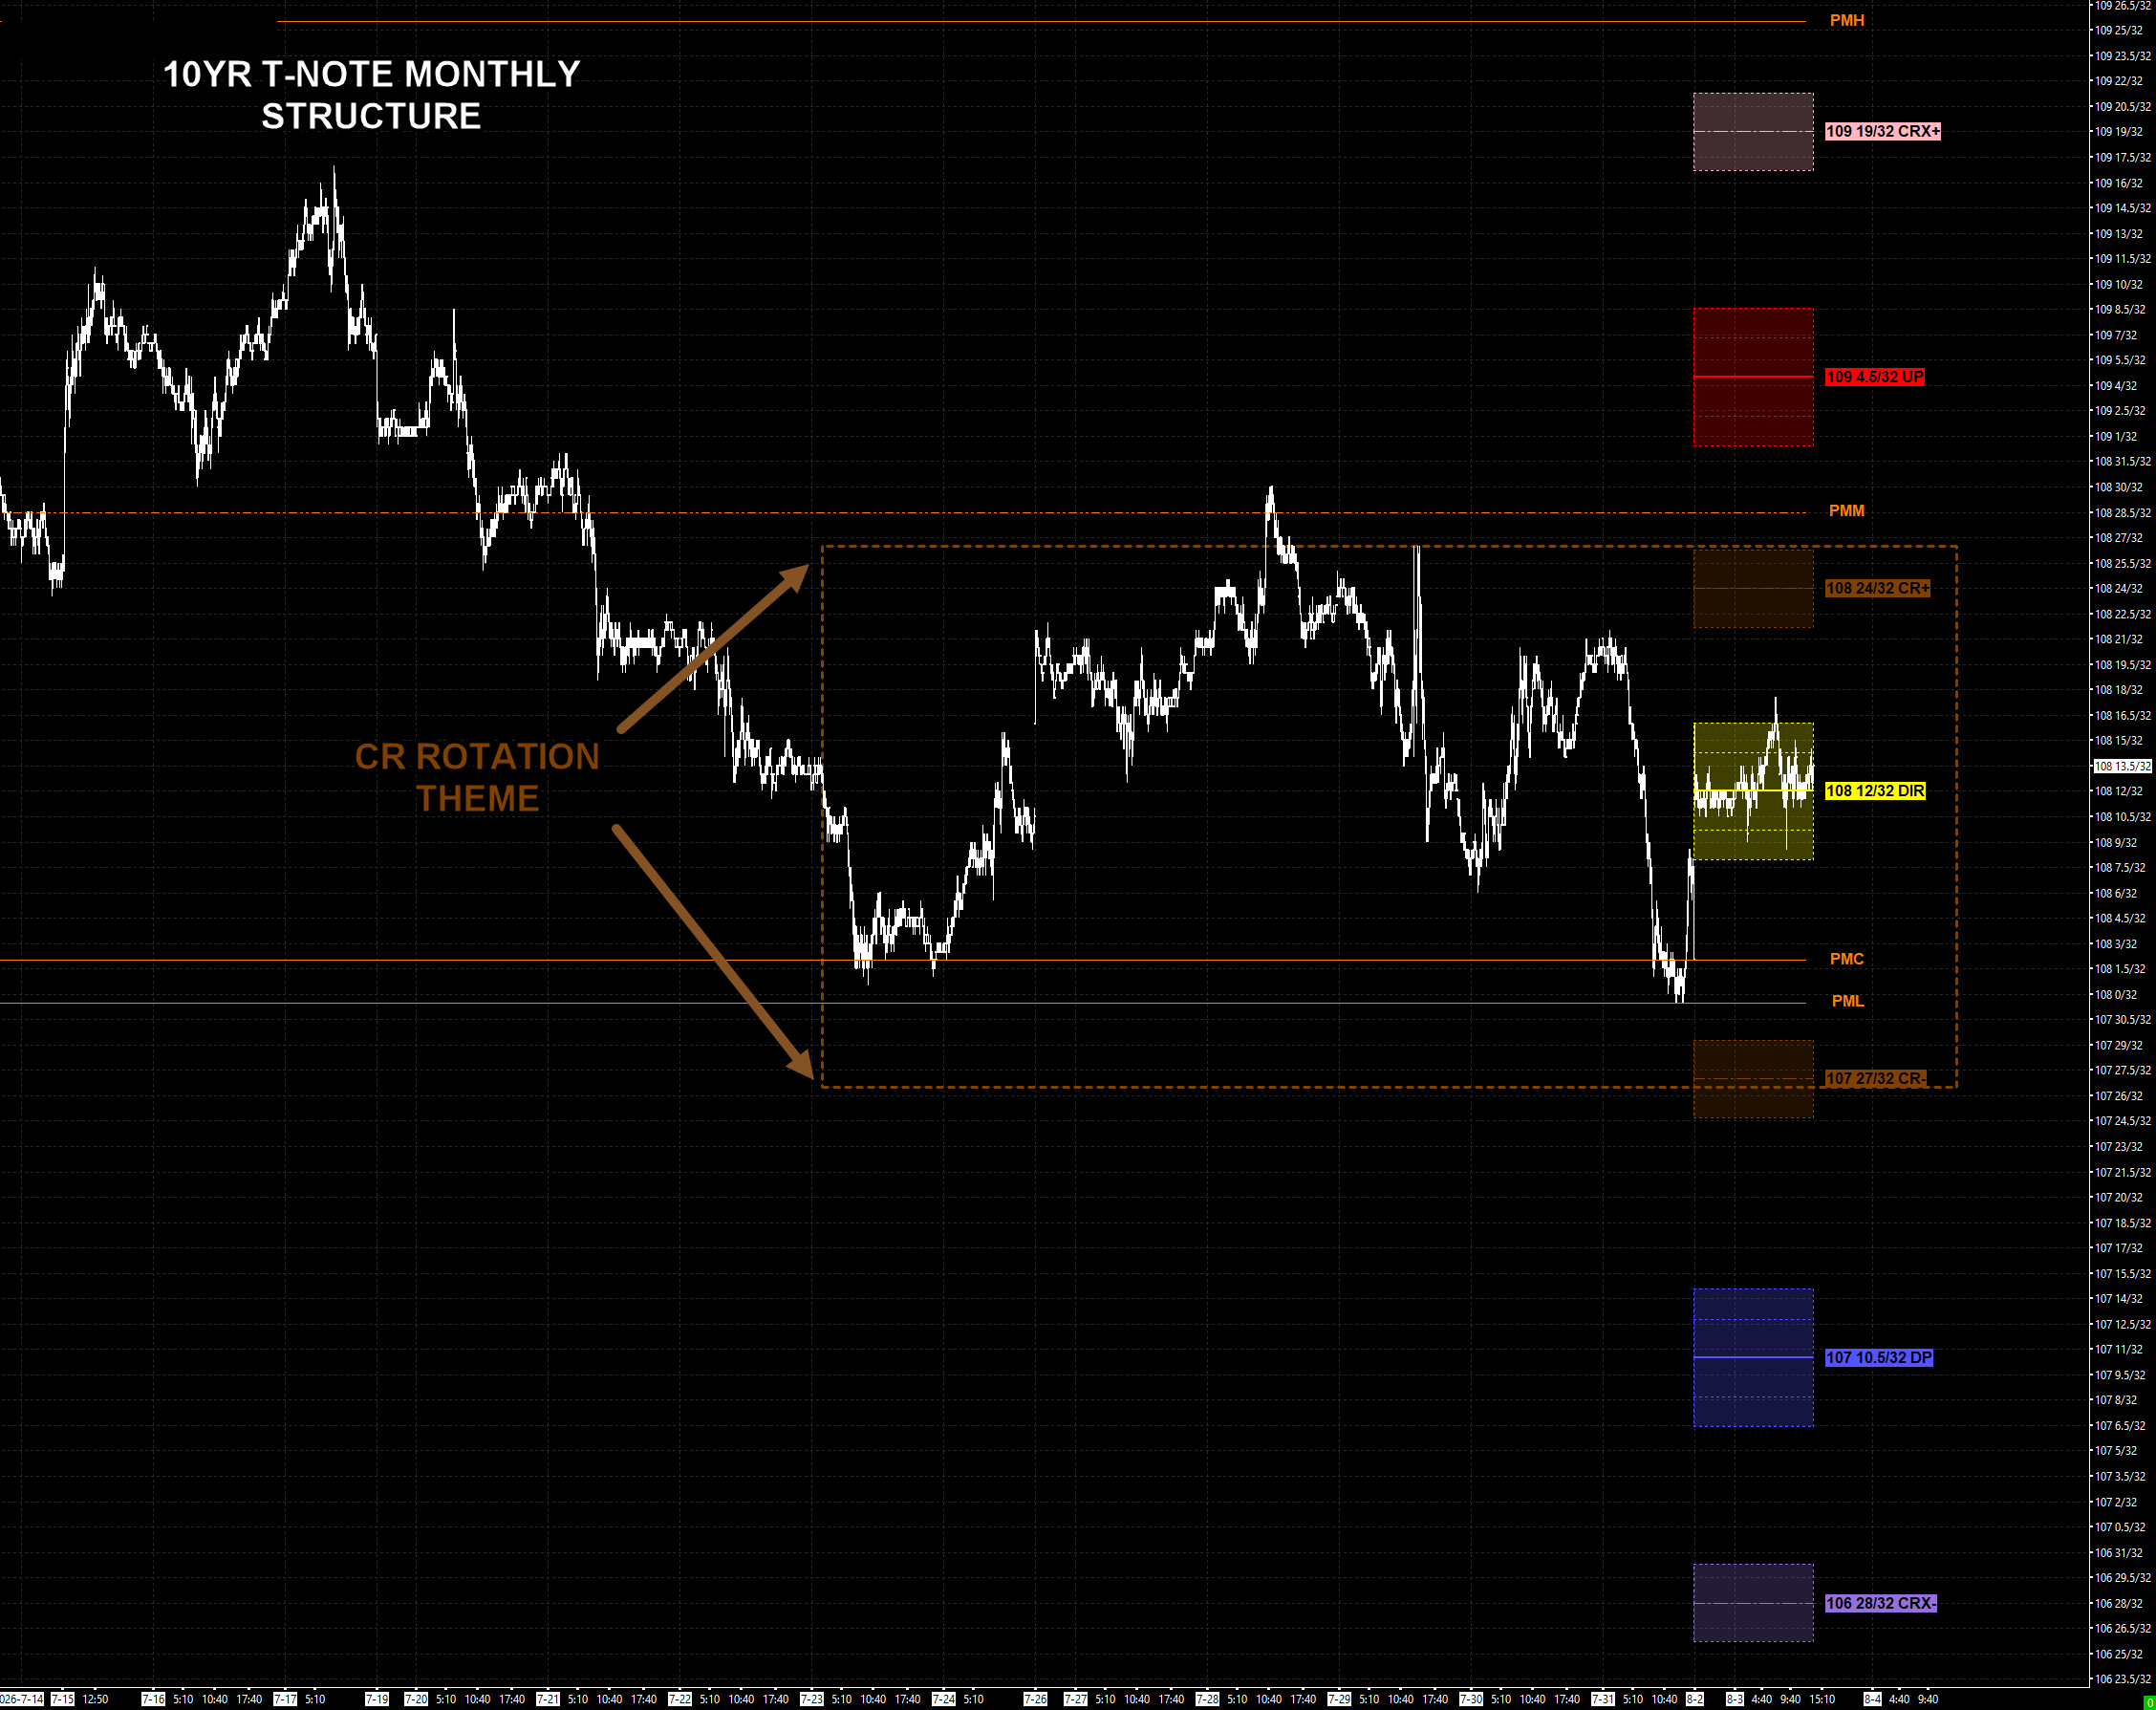
If the negative momentum is going to continue, then any push into the 108-28.5–108-24 zone gets rejected. A reclaim of structure does not remove the negative threat — it delays it — with the 109-04.5 UP into the 109-08.5 metric (≈ 4.57%) the likely lid. Only above there is a sentiment shift confirmed, and that opens the 110-01.5 UT1 (≈ 4.43%) and the 110-16 R Level (the sentiment-bias anchor, ≈ 4.36%) — the lower-yield case.
Trading below the 108-12 DIR puts the market in an @RISK state and threatens fresh lows toward the 107-27 CR- (≈ 4.76%). If the stop-and-go, break-to-new-lows-then-rally rhythm is going to continue — which is exactly what a CR Rotational theme looks like — the market stabilizes above there. A held failure from 107-27 extends the weakness to the 107-10.5 DP (≈ 4.84%), with the 106-28 CRX- (≈ 4.90%) the flush low for an event. Use caution; volatile conditions are anticipated.
If 106-28 is the low for the month, price integrity holds. But a held trade and failure from there is a sign of weakness that projects as low as 105-02.5 (≈ 5.17%), with 104-05 (≈ 5.30%) the lower extreme for Q3 — the deep rubber-band-snap case.
The note is coiled on its Monthly Directional Pivot at 108-12 (≈ 4.68%) in a Critical Range rotational, summer-thin tape. The base case is two-sided rotation — the snap-back to 108-28.5 / 108-24 is live now, and if the negative lean holds it gets rejected there. Below 108-12 is @RISK and points at 107-27 (≈ 4.76%), then the 107-10.5 DP (≈ 4.84%) and the 106-28 flush (≈ 4.90%). Above 109-04.5–109-08.5 — the UP, ≈ 4.57% — takes the edge off toward 110-01.5 and 110-16 (≈ 4.43% / 4.36%).
In yield: capped and pressing lower in price means yields grinding higher — the rubber band loading. A real reclaim up the map is the pressure releasing the other way. The structure will tell us which. That is what we track this month.
Every level here — DIR, Critical Range, UP/DP, the targets — comes off the same structural overlay, on every market and timeframe. See how it is built on the PriceMap page →