10-Year T-Note: The Opening Range Is Set
A month of trade isn’t one continuous blur — it moves through phases, and knowing which phase you’re in tells you how to read the tape. The first stretch is the Opening Phase, where the market sets its Opening Range: the high (ORH), the midpoint (ORM), and the low (ORL) that frame where value has been accepted so far. It’s the market taking its first inventory of the month — the balance it will either build on or break from.
That phase is now complete. The Opening Range is drawn, and today the market enters the Discovery Phase — the search for where it’s willing to trade next. Price leaves the opening balance to discover acceptance higher or lower, and the Opening Range parameters become the reference that tells you which way discovery is running. Above the range, higher value; below it, lower. The edges are the signal.
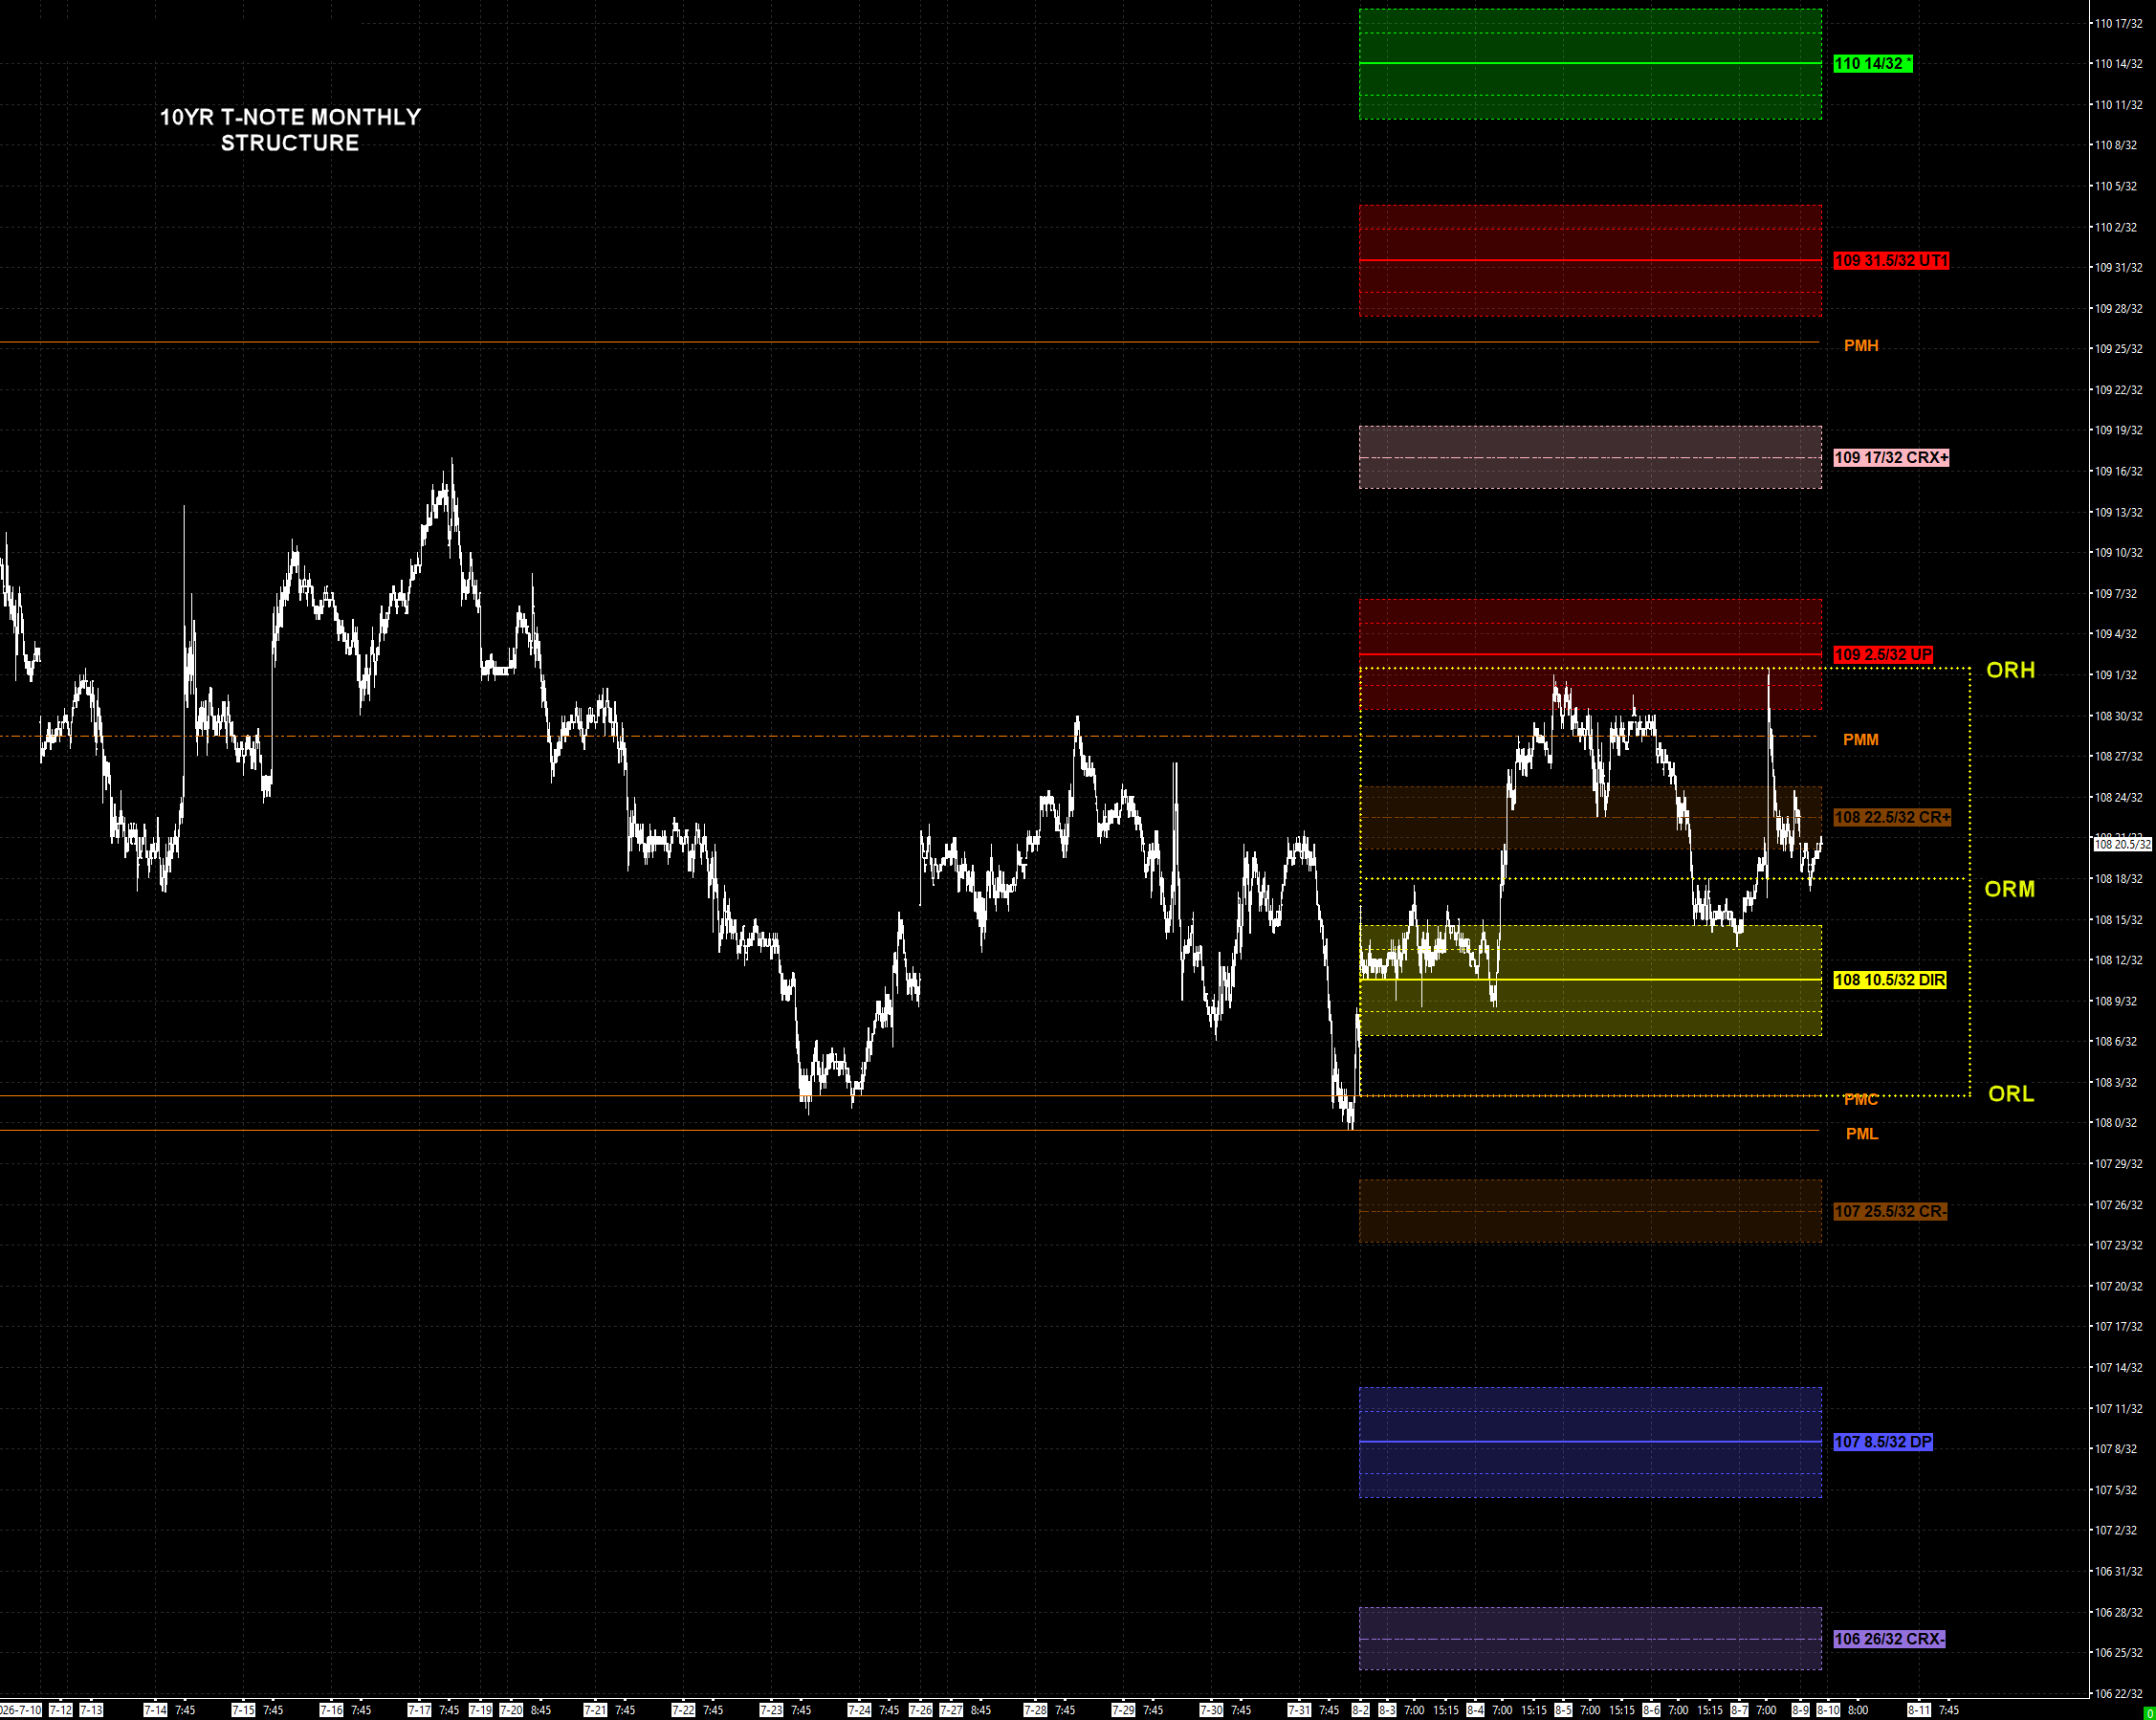
ORH — Opening Range High (109-02.5): the top of the opening balance, aligned with the UP.
ORM — Opening Range Midpoint (108-18): the balance point — the pivot of the range.
ORL — Opening Range Low (~108-03): the floor, sitting with the prior-month close.
Hold above the midpoint and discovery leans higher; lose it and the search turns lower.
Price is sitting in the zone that matters: the 108-22.5 CR+ (≈ 4.63%) down to the 108-18 ORM (≈ 4.65%). This is the hinge. A signal off this band — acceptance above it or rejection through it — is the first tell of where Discovery takes the month. Hold the zone and the market can press the top of the range; lose the ORM and it drops into the lower half of the opening balance, on the defensive.
We quote in points and 32nds — 108-18 means 108 and 18/32 — and pair each level with its approximate yield. The downside of the map is the higher-yield case; the upside, lower. (The futures-to-yield tie runs through the cheapest-to-deliver note, so treat the yields as orientation, not the cash tick.)
| ZN | TY level | Price | ≈ 10-Yr yield |
|---|---|---|
| R — Sentiment Bias | 110-14 | ≈ 4.37% |
| UT1 — upside target | 109-31.5 | ≈ 4.43% |
| PMH — prior-month high | 109-25 | ≈ 4.47% |
| CRX+ — upside breakout | 109-17 | ≈ 4.51% |
| UP / ORH — the lid | 109-02.5 | ≈ 4.57% |
| PMM — prior-month midpoint | 108-28 | ≈ 4.60% |
| CR+ — upper validation | 108-22.5 | ≈ 4.63% |
| ORM — opening midpoint (price here) | 108-18 | ≈ 4.65% |
| DIR — the monthly pivot | 108-10.5 | ≈ 4.68% |
| ORL / PMC — opening low / prior close | 108-03 | ≈ 4.72% |
| PML — prior-month low | 108-00 | ≈ 4.74% |
| CR- — lower validation | 107-25.5 | ≈ 4.77% |
| DP — downside pivot | 107-08.5 | ≈ 4.85% |
| CRX- — event flush | 106-26 | ≈ 4.90% |
Nothing in the read has changed since the kickoff. The 10-Year is in a Bear Trend — rallies stay corrective until the market accepts them — and the 109-02.5 UP, which lines up with the ORH, remains the lid on the underlying negative tone.
A rise above the UP that validates through the 109-06.5 boundary (≈ 4.56%) confirms a shift to a Bear Trend Corrective state — a counter-trend rise searching for resistance — targeting the PMH (109-25, ≈ 4.47%) and the 110-14 R LEVEL (≈ 4.37%). That R level is where the selling energy sits: in a Bear Trend it’s the peak for the next leg lower — and a sound place to hedge for higher rates later this month or into next.
Trading below the 108-18 ORM puts the market back on the defensive, targeting the PMC (108-03) and PML (108-00). Use caution. Buyers will likely try to keep things stable, but the note is vulnerable to an extension lower — the 107-08.5 DP (≈ 4.85%), and if that fails, the 106-26 CRX- (≈ 4.90%). Don’t press into weakness.
More stop-and-go action is the base case — the two-sided, false-break rhythm of a bear-trend digestion, not a one-way move.
The Opening Phase set the range; Discovery decides the month. The 108-22.5 CR+ / 108-18 ORM zone is the hinge — hold it and the market can work the 109-02.5 UP / ORH lid; a validated push above opens the corrective case to the PMH and the 110-14 R LEVEL (≈ 4.47% / 4.37%), the spot to hedge for higher rates. Below the ORM is defensive — 108-03 / 108-00, then the 107-08.5 DP (≈ 4.85%) and 106-26 CRX- (≈ 4.90%). Stop-and-go, two-sided; don’t press into weakness.
In yield: pressing higher in price is yield easing; the defensive case below the ORM is yield grinding back up. The structure will tell us which.
Every level here — DIR, Critical Range, UP/DP, the Opening Range, the targets — comes off the same structural overlay, on every market and timeframe. See how it is built on the PriceMap page →