Bitcoin Over Under
Market structure is the base framework, it is the foundation that every study, method and strategy trades within. Inside it, the R Level is the sentiment bias for the period. It is not fixed on the ladder. It is where reversals begin and where breakouts are confirmed or denied. Where it sits relative to price sets the regime — the market structure bias — for that period.
The R is overhead. Rallies into it are fades until price breaks out and holds above — that break is the transition to a positive regime. Until then the R is the containment, and the period’s lean is negative.
The R is underneath. Pullbacks into it are buys while it holds; the move has a base. A break and hold below the R is the transition to a negative regime. Until then the period’s lean is positive.
Every time frame — DWMQY, Daily through Yearly — carries its own R. The shorter time frames are the momentum triggers within the larger ones. The Daily R and Daily PriceMap update every day — the most aggressive read. The Weekly resets once a week, for Bitcoin that’s Saturday evening. The Monthly at the start of a new month and the Quarterly at the start of the new quarter. When the R sentiment bias of every time frame points the same way, there is confluence across the stack. When it does not, the market is running a more complex dynamic — one time frame fighting another.
If your strategy is geared toward day trading, the Daily PriceMap structure and sentiment bias are the foundational framework for your tactics. Are the higher time frames supporting the daily structure, and is that alignment aligned with your position? Longer-duration swing and position traders working the Monthly, or in this example the Quarterly, use the shorter durations for tactical position and risk-management adjustments.
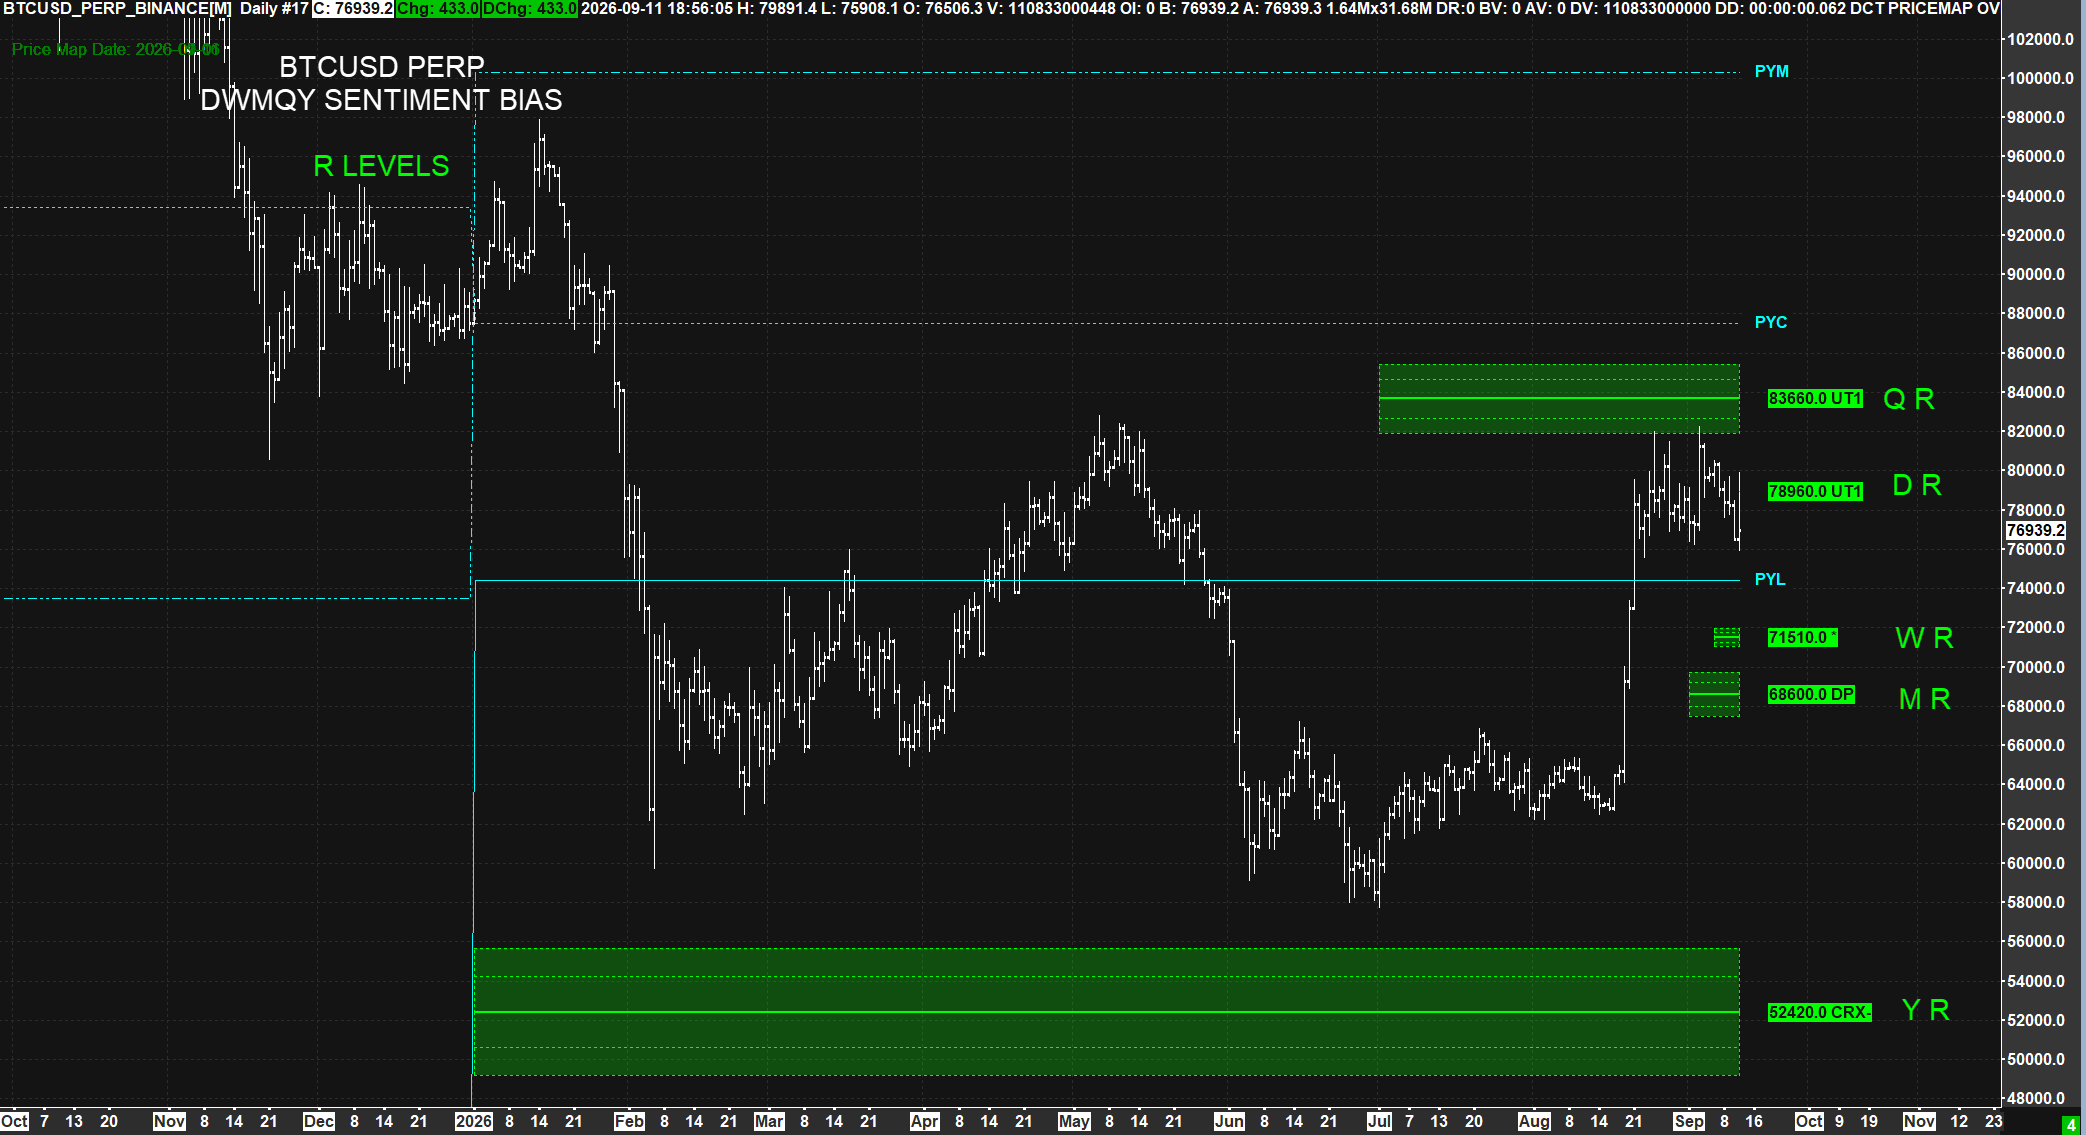
Fact: the Weekly and Monthly sentiment are aligned with the Yearly, and today’s Daily R is the true test of that alignment. The Quarterly 83,660 R, set on July 1, remains the current containment and the over-under for Q3. Price is trading below the Daily R, 78,960, questioning the market’s ability to extend — today.
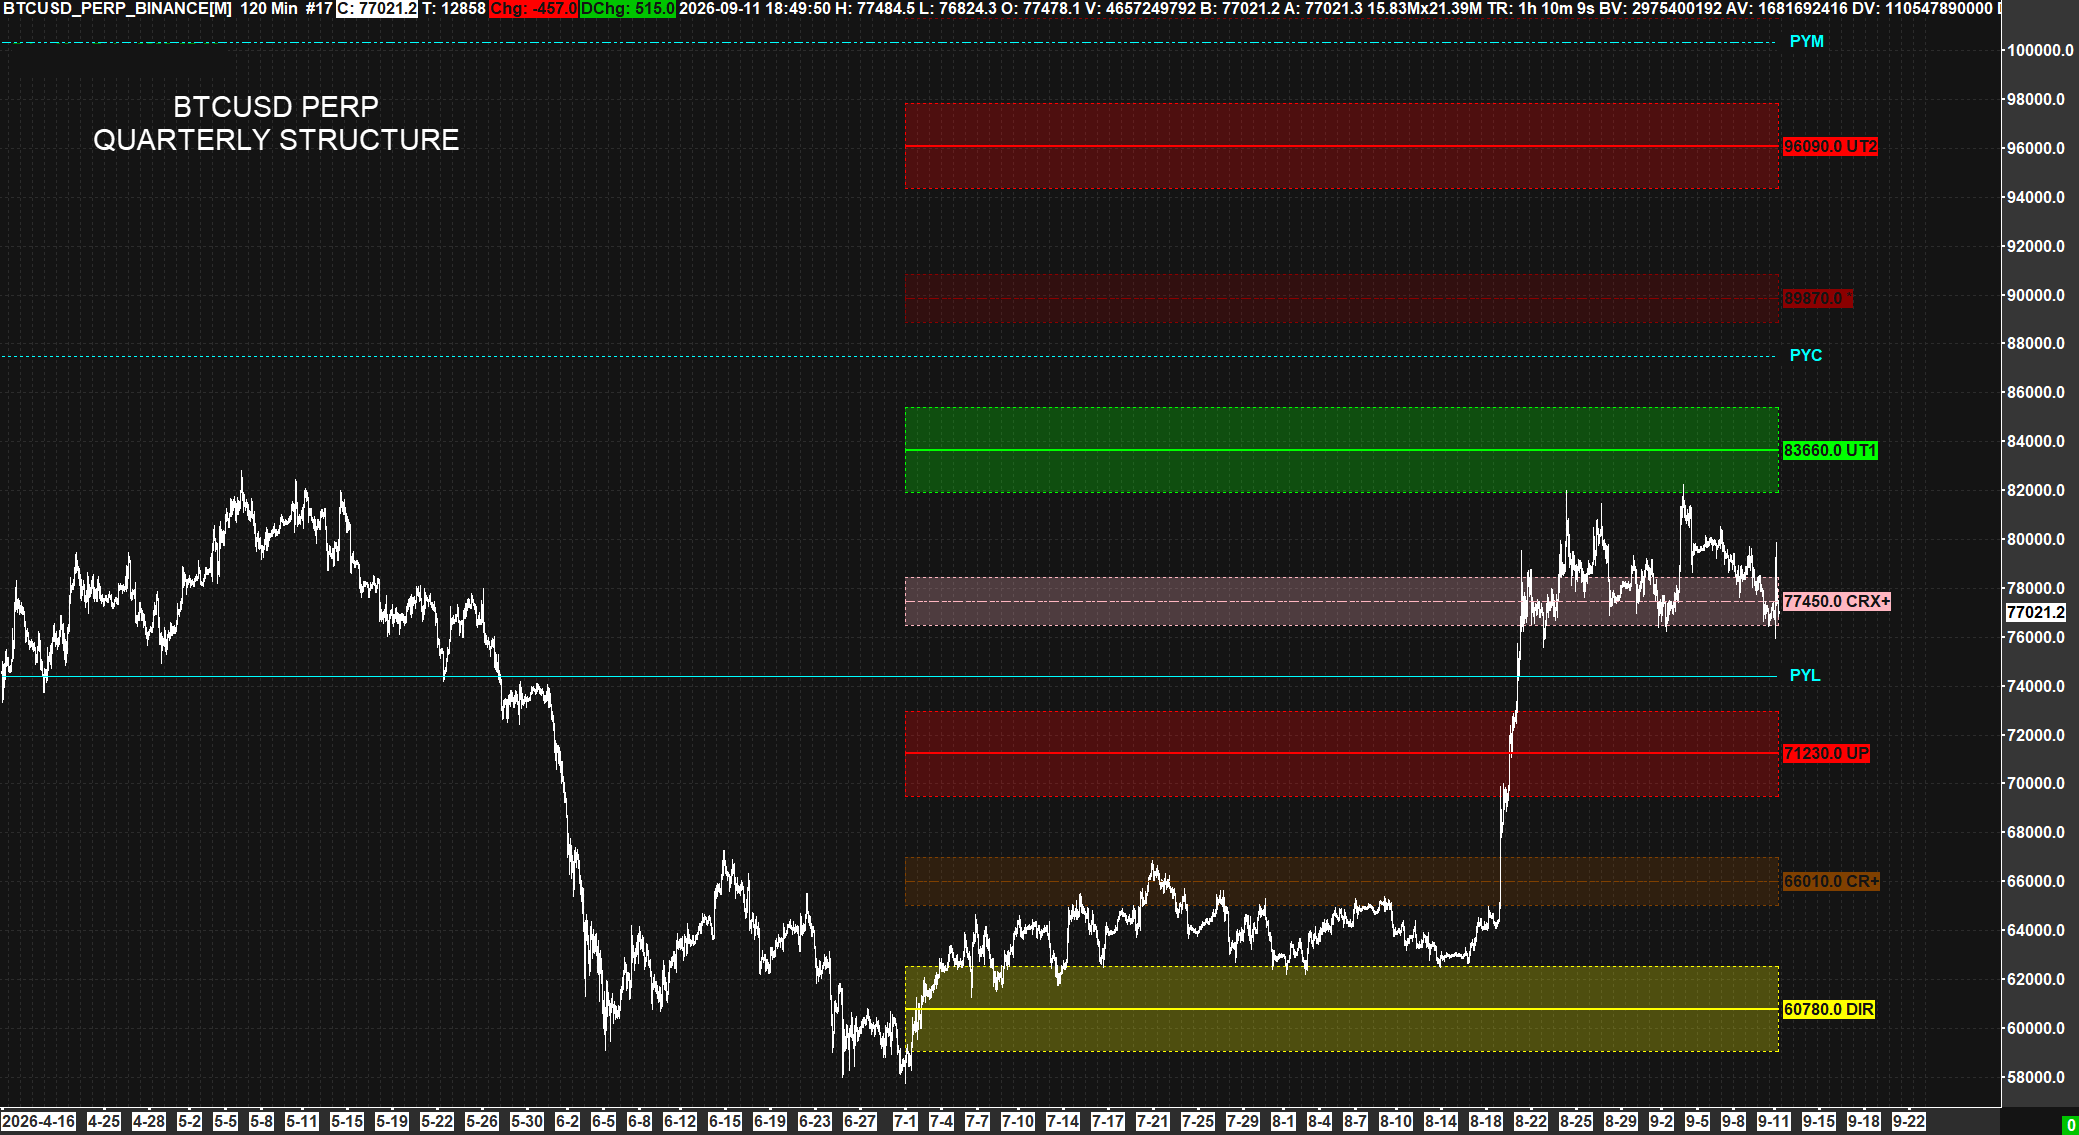
On September 8 the read was set. Bitcoin had reclaimed the prior-year low (PYL) at 74,420, broken out above the Quarterly Upside Pivot (UP) at 71,230, and was holding the 77,450 CRX+ — the upside breakout validation — under the Quarterly R at 83,660. The CRX+ and its metric boundary were named the point of inflection for the balance of the month. A break under the boundary would be a tap on the brakes, not a turn. The PYL held the final say.
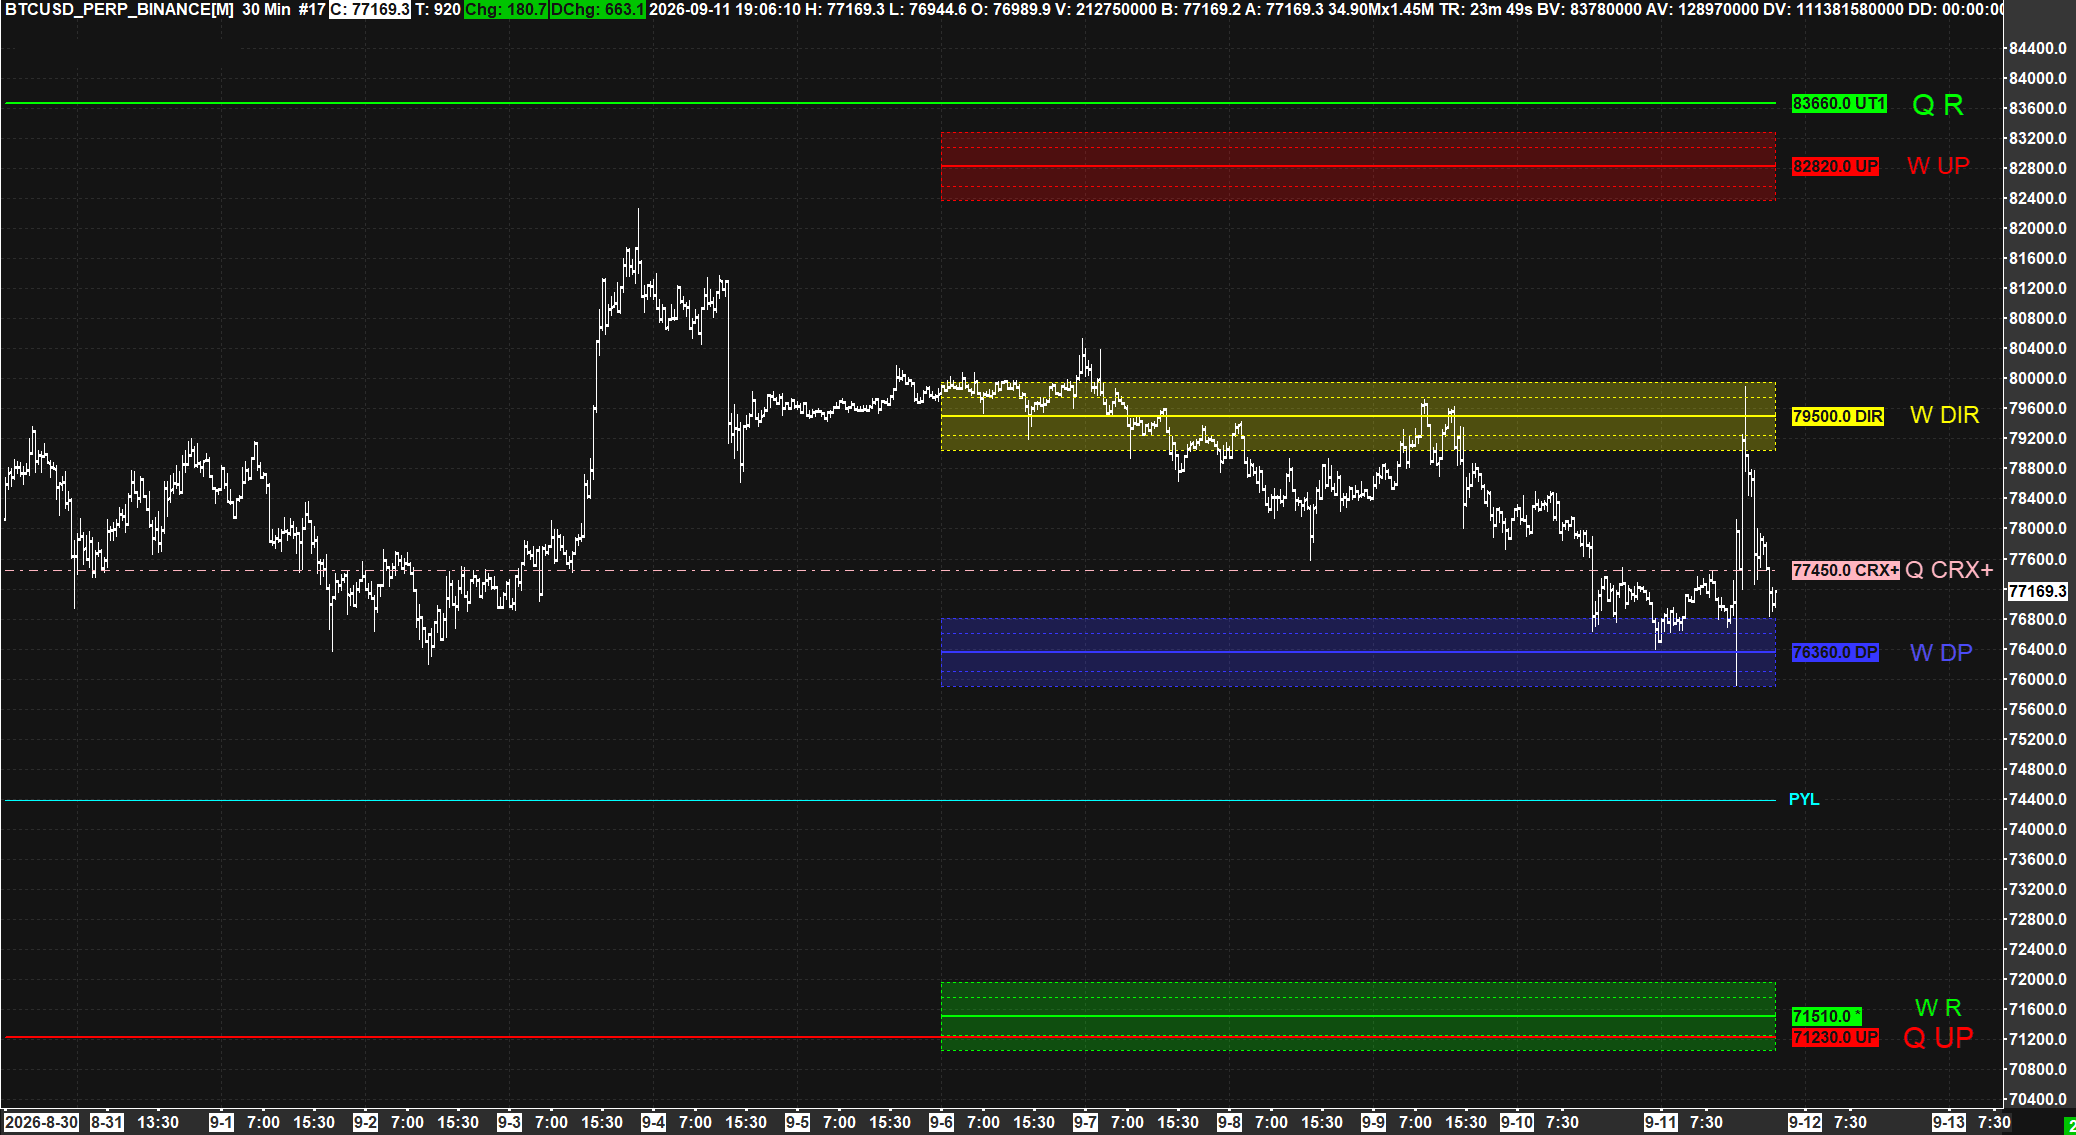
The third test of the CRX+ came in this week and pressed harder than the first two — price probed under the boundary to a 75,908 low and reclaimed the CRX+ in the same session. The PYL was never in play. Brakes tapped, PYL held. The rally off that low ran to 79,891 and was rejected at the Weekly DIR, the Weekly momentum pivot; price is back at the CRX+, 77,000 as this is written, still above the 76,360 W DP. The corrective rise stays in command above that band. The 83,660 R remains the upside tell.
In the current live example the shorter-term Weekly PriceMap provided insight within the larger Quarterly structure: the 79,500 W DIR has been the hurdle for positive momentum all week, keeping the environment soft down to the 76,360 W DP. Today’s rally into the W DIR failed at 79,891 and price rotated back to the Q CRX+, sitting on top of the W DP band. Basis the Quarterly structure, we knew the 77,450 CRX+ was the start of a support band that extended down to the 74,420 PYL. The Weekly identified that the 76,360 W DP, aligned with the most recent price pullback — the higher low at 76,185 — could be the trigger to a lower rotation down to the 71,510 W R and 71,230 Q UP alignment. A decision point defined at the start of the week, factored into your method and tactics before the fact.
Refresher · the Critical Range, validation, and where the Weekly conflicts with the Quarterly
The PriceMap Critical Range is the neutral zone for the period, bounded by the Upside Pivot (UP) and the Downside Pivot (DP), with the Directional (DIR) at its center as the momentum pivot. A break above the UP is not confirmed until price holds the CRX+ — the upside breakout validation. Full framework on the PriceMap page →
In the live example the Quarterly says the breakout is validated above the 77,450 Q CRX+. The Weekly says momentum is soft below the 79,500 W DIR. That is the conflict — the Weekly momentum pivot sitting above the Quarterly validation. The 76,360 W DP in confluence with the Q CRX+ band fine-tunes the validation area: 77,450 down to 76,360 is where the hold or the failure gets decided.
Without a baseline, emotions overwhelm and cloud the decision. With an objective framework there is clarity at the point of decision. Observing price action within structure, in the context of sentiment bias regimes, gives a clear picture of what is true — in real time, not in hindsight at the end of the period. You align methods to anticipate outcomes instead of reacting to them after events have occurred with everyone else. This is your edge.
The Weekly structure resets Saturday. How the Weekly sentiment shifts will add new insight into how much the market is going to lean into current events; the new Daily structure will enhance that read each day. What will not change until the end of the month: Quarterly sentiment rests at 83,660 as the upside containment, and 68,600 Monthly sentiment is the initial lower base for a negative transition. Does the market wait for news, or for structure to reset for the new quarter? Price is king. Wherever it is, that is the truth in the moment. Market structure is the lens to view it through and interpret what it means.
76,360 W DPBase supporting the positive momentum. Corrective rise in command above it. Failure signals potential for lower rotation.
The Weekly resets Saturday. The Daily resets every day. Sign up for a two-week trial and see the structure update when it happens — for Bitcoin, and for whatever markets you are trading. Same method, unified across all asset classes.
Start the two-week trial →