What’s Next?
Warsh delivered hawkish on the front: inflation not meaningfully slowing, 2% a “firm and fixed” target, financial conditions not restrictive. The curve split. The front and belly sold off — the 2-Year yield up nine basis points — while the long end held, the 30-Year yield actually lower. A bear flattener.
Here is the whole complex, the month’s price action so far read through the monthly PriceMap. The green lines mark the shorter-frame R’s — Daily and Weekly — and price is below all of them.
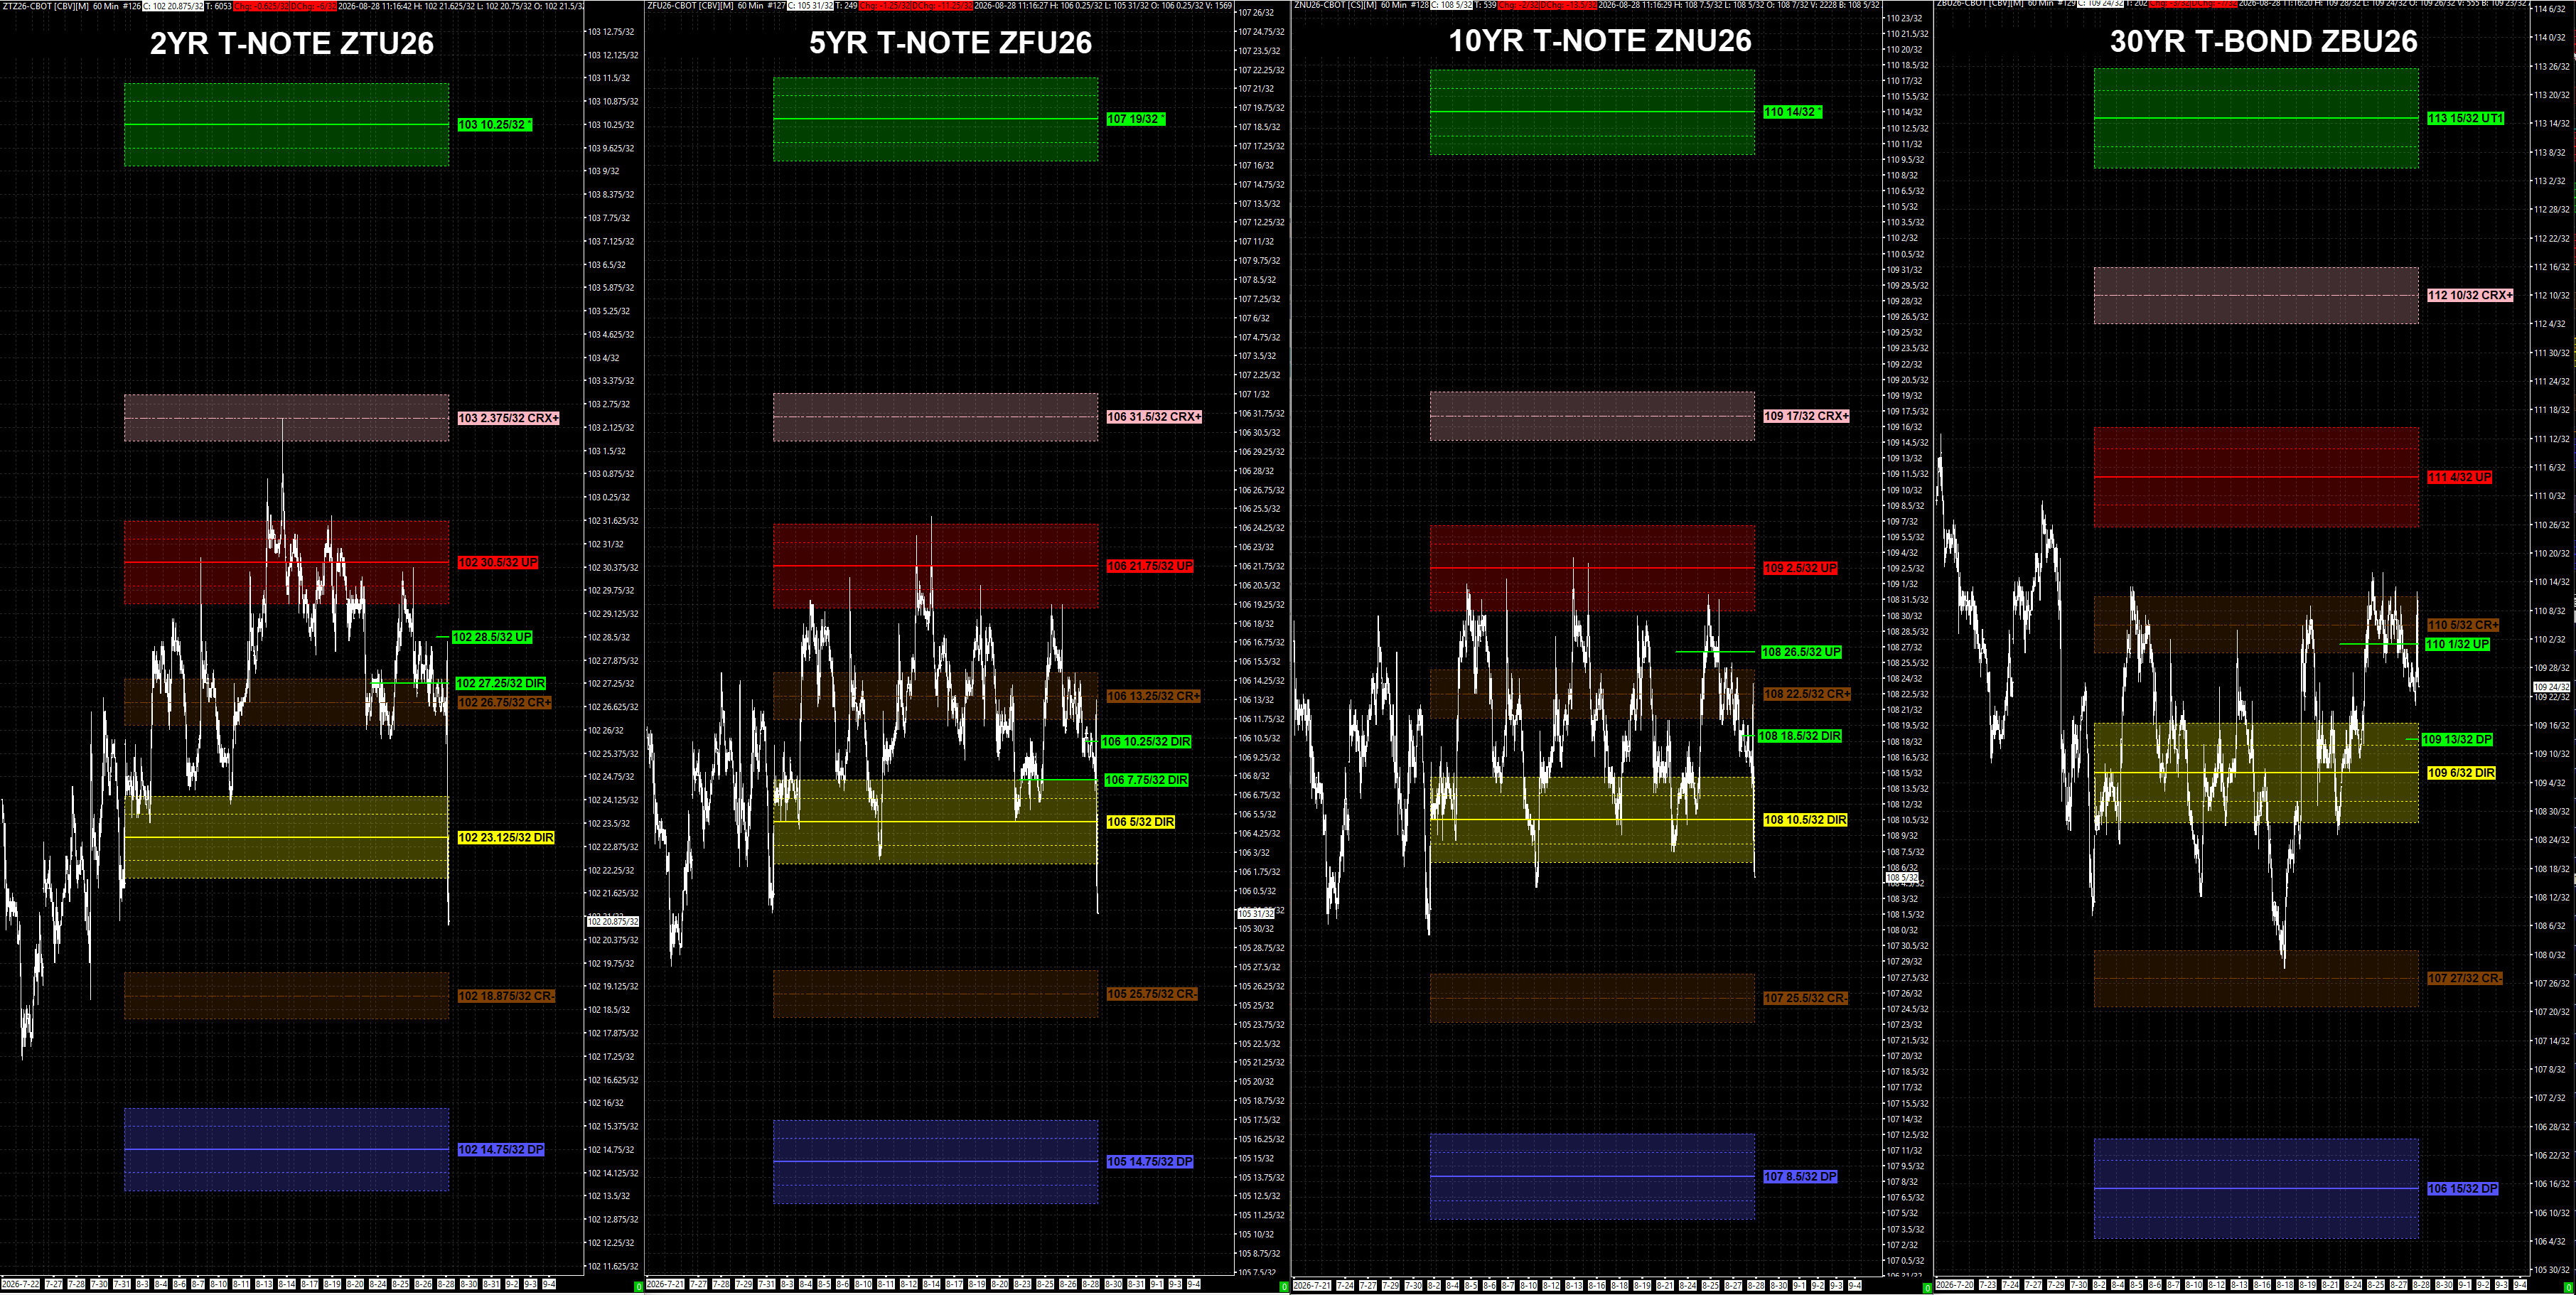
Read plainly: the front and belly have broken down through their Monthly DIRs — the Directional, the center of the map — and the move has accelerated. The 5-Year and 10-Year are the worst of it, driving off their Directionals toward the Monthly CR- with the downside pivots beneath; the 2-Year has given up its DIR too. Only the 30-Year still holds above its Directional. All four are under their monthly R, and under the Daily and Weekly R’s overhead. This is not a drift — it is a decisive break of the Monthly Directional, the belly leading it lower.
Here is where the decision comes in. That monthly break is real — but this monthly structure is near the end of its life. At Monday’s close — the last trading day of August — the monthly PriceMap resets, printing a fresh monthly structure for September, and the futures roll their front month in the same window. A structure carries its most information in the middle of its period; into the reset, the expiring monthly tells you less and less about what is ahead.
So the operator’s question is not “what does today’s monthly say” — it is which lens do I read from here. You don’t forecast off a structure with days left on it. You step up to the one that doesn’t reset with the month, and that the new monthly will print inside. That is the move: shift the lens up, and read what’s next from the frame that survives Monday.
The quarterly PriceMap is the durable frame here. It is set for the whole quarter, it does not reset with the month, and the new monthly will print inside it — which is why it tells you now how September’s structure is likely to set up, before that monthly exists. Here is the complex on the quarterly.
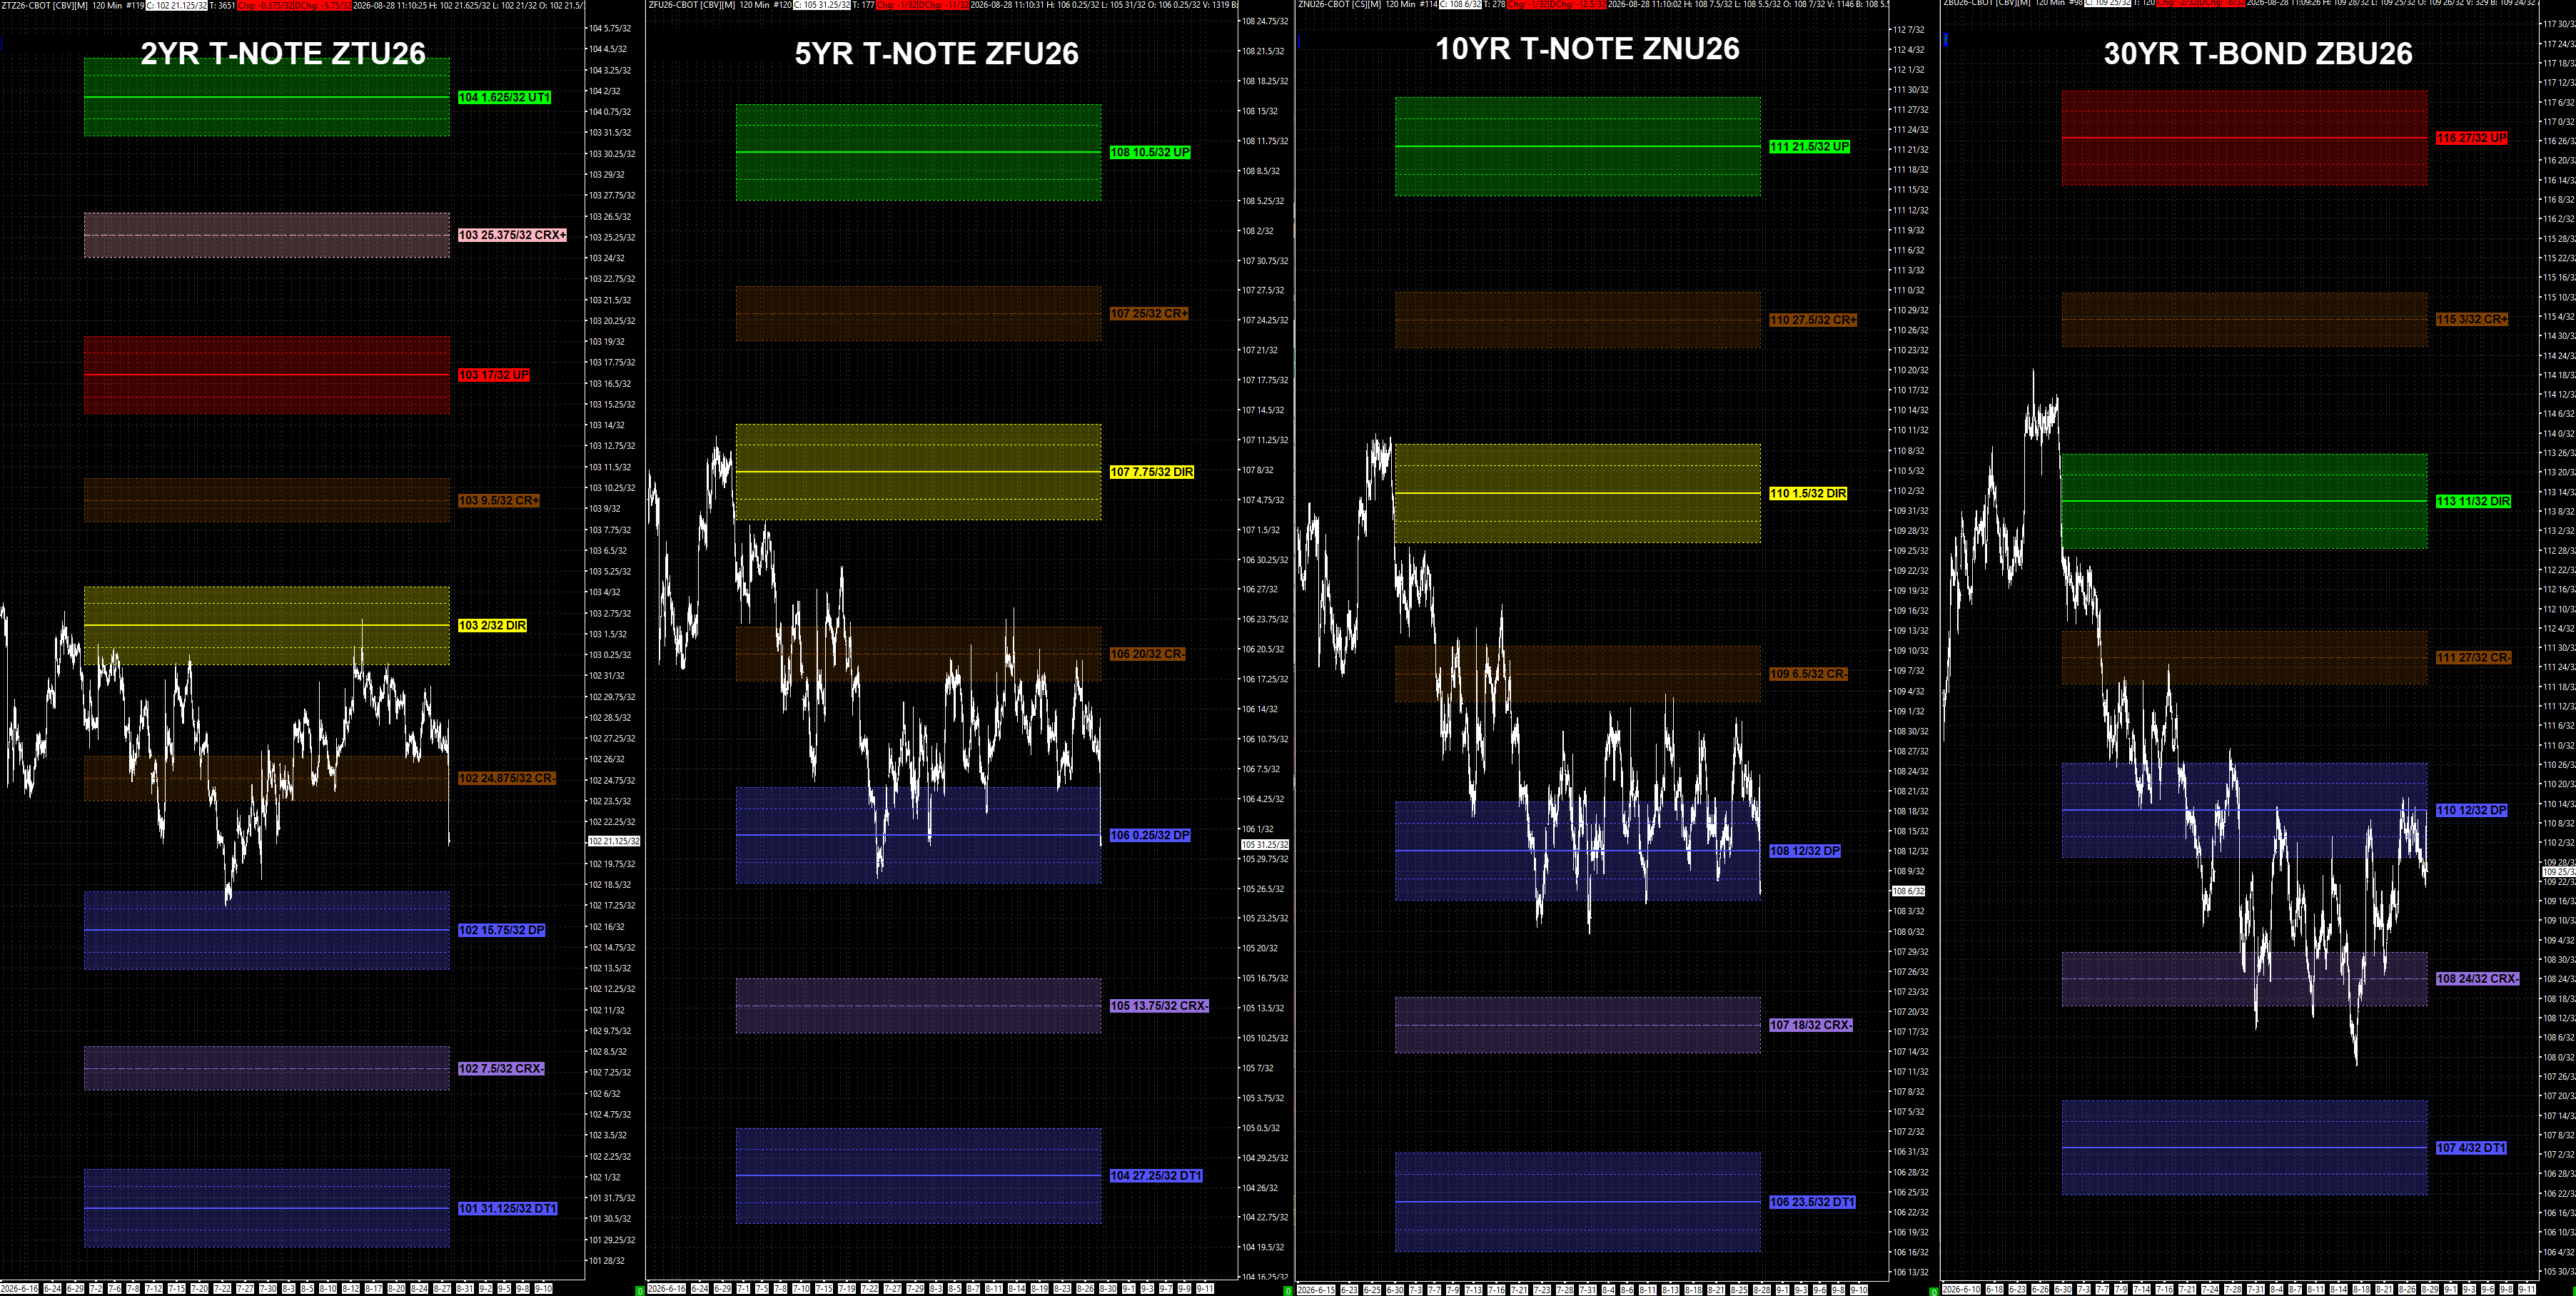
The 10-Year has pressed down to — and now just under — its Quarterly DP at 108-12, the line that lands right on its Monthly DIR at 108-10.5, the Directional you just saw on the monthly. The quarterly floor and the Monthly Directional on the same price, with the Daily and Weekly focused into the same zone: four time frames, one line. That is the level the market is deciding on — and at 108-03, price is leaning on the underside of it right now.
And the long end is already through. On the quarterly, the 30-Year broke below its Quarterly DP at 110-12 earlier — a downside break, structure pointing lower, the 108-24 validation next and room beneath it. So both ends are now at or below their quarterly floors: the long end already through, the belly leaning on the underside of its line right now. That is the flattener, on the quarterly, and it sharpens the question that frames September — does the 10-Year reclaim 108-12, the line the whole complex is built on, or accept below it and follow the long end down?
That is the read off the structure — the PriceMap, the market intelligence we publish. I put the whole picture to Navigator: the keynote result, the price action within the structure, and what’s next. Here is what came back.
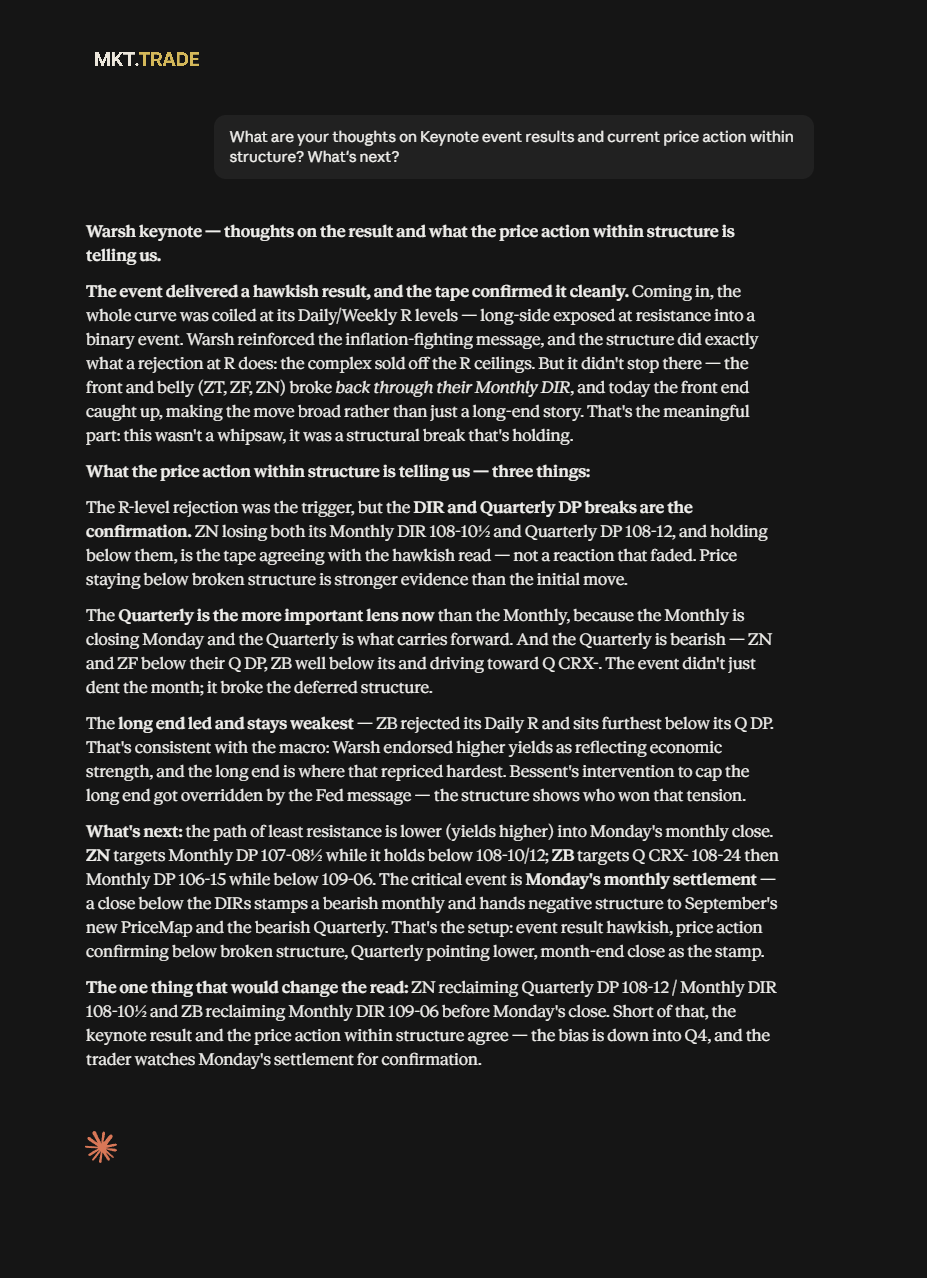
It lands on the same shift. In Navigator’s read, the confirmation is not the selloff off the R levels — it is price holding below broken structure, with the 10-Year under both its Monthly DIR (108-10.5) and its Quarterly DP (108-12). The Quarterly is the lens that matters now, because the Monthly closes Monday, and the Quarterly is bearish across the curve — the long end furthest gone, driving toward its Quarterly CRX-. The tell for all of it is Monday’s monthly settlement: a close below the DIRs stamps a bearish month and hands negative structure to September’s new PriceMap. The one thing that flips it — the 10-Year reclaiming 108-12 / 108-10.5 and the 30-Year reclaiming its 109-06 Monthly DIR before that close.
That is the whole use of it. The PriceMap marks the structure; Navigator reads the complex against it and hands back the objective benchmark — a check on whatever bias you walked in with. It doesn’t make the call. It keeps the call honest. You stay the operator.
The event is behind us and the month has traded negative on the monthly map. Monday it resets. Ahead of that, the read moves up to the quarterly — and the quarterly hands you a single line into September: the 10-Year’s Quarterly DP at 108-12, the level four time frames agree on, with price leaning on the underside of it now. Reclaim it and the quarter can turn the floor into a reversal; accept below and the long end has already shown you the path — and Monday’s monthly settlement is the stamp that carries whichever it is into September.
That is the discipline the framework gives you. When one structure ends, the next one up is already there. You are never without your bearings.
The PriceMap is the fixed structure the read is built on — the same overlay on every contract and time frame, Daily through Yearly, published every day for forty years. Navigator, our AI agent, reads the stack against it in one pass and hands you the objective benchmark — which time frame is in charge, and the line it turns on. See the Navigator → or how the map is built on the PriceMap page →