Who’s in Charge?
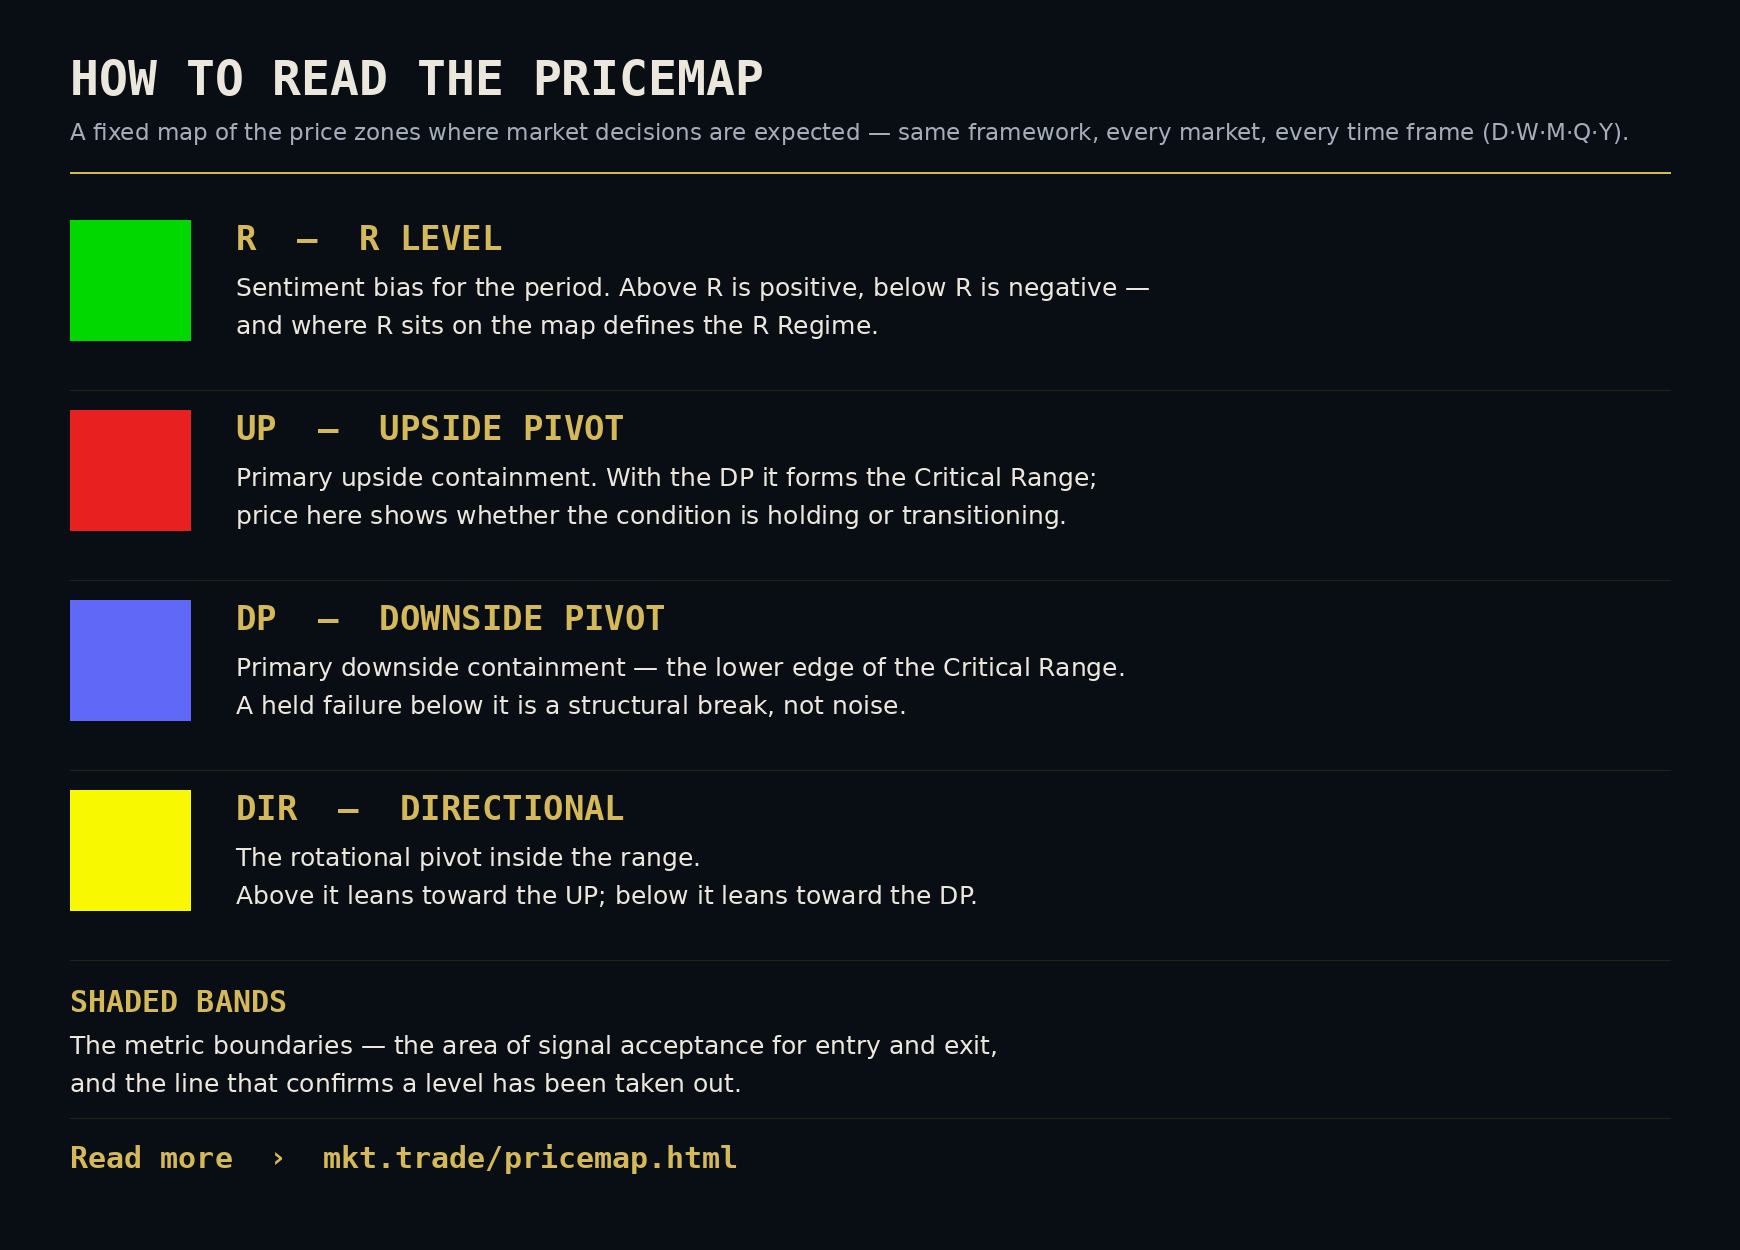
I read everything through market structure first — an objective baseline before any capital is committed. The PriceMap is that baseline: a fixed map of the price zones where market decisions are expected, drawn the same way on every market and every time frame — daily, weekly, monthly, quarterly, yearly. Before we get into the read, here is the key I include for anyone new to the charts.
The monthly is the time frame that matters most to the people who move size. It is the standard performance metric for fund managers, so the monthly structure is always key. But structure is fixed for its period — it is set for the month and it resets at the start of the next one.
That is the catch. As a month moves into its settlement phase — the back end, when the period is winding down — the current monthly structure has less and less time left to matter. Its levels start to lose value relative to the other time frames. The closer we get to the new month, the less the old monthly map is telling us about what comes next.
So you do exactly what the framework is built for: you change the lens. You drop down to the daily and weekly for near-term momentum inside the settlement range, and you lift up to the quarterly for the longer-term foundation of what sets up next month. Same map, more time frames. That is how you find out who’s actually in charge.
Start by plotting the sentiment bias — the R Level — for the daily, weekly and quarterly directly onto the monthly structure. Now every frame’s lean is visible on one map, and the shorter-term momentum reads inside the bigger picture.
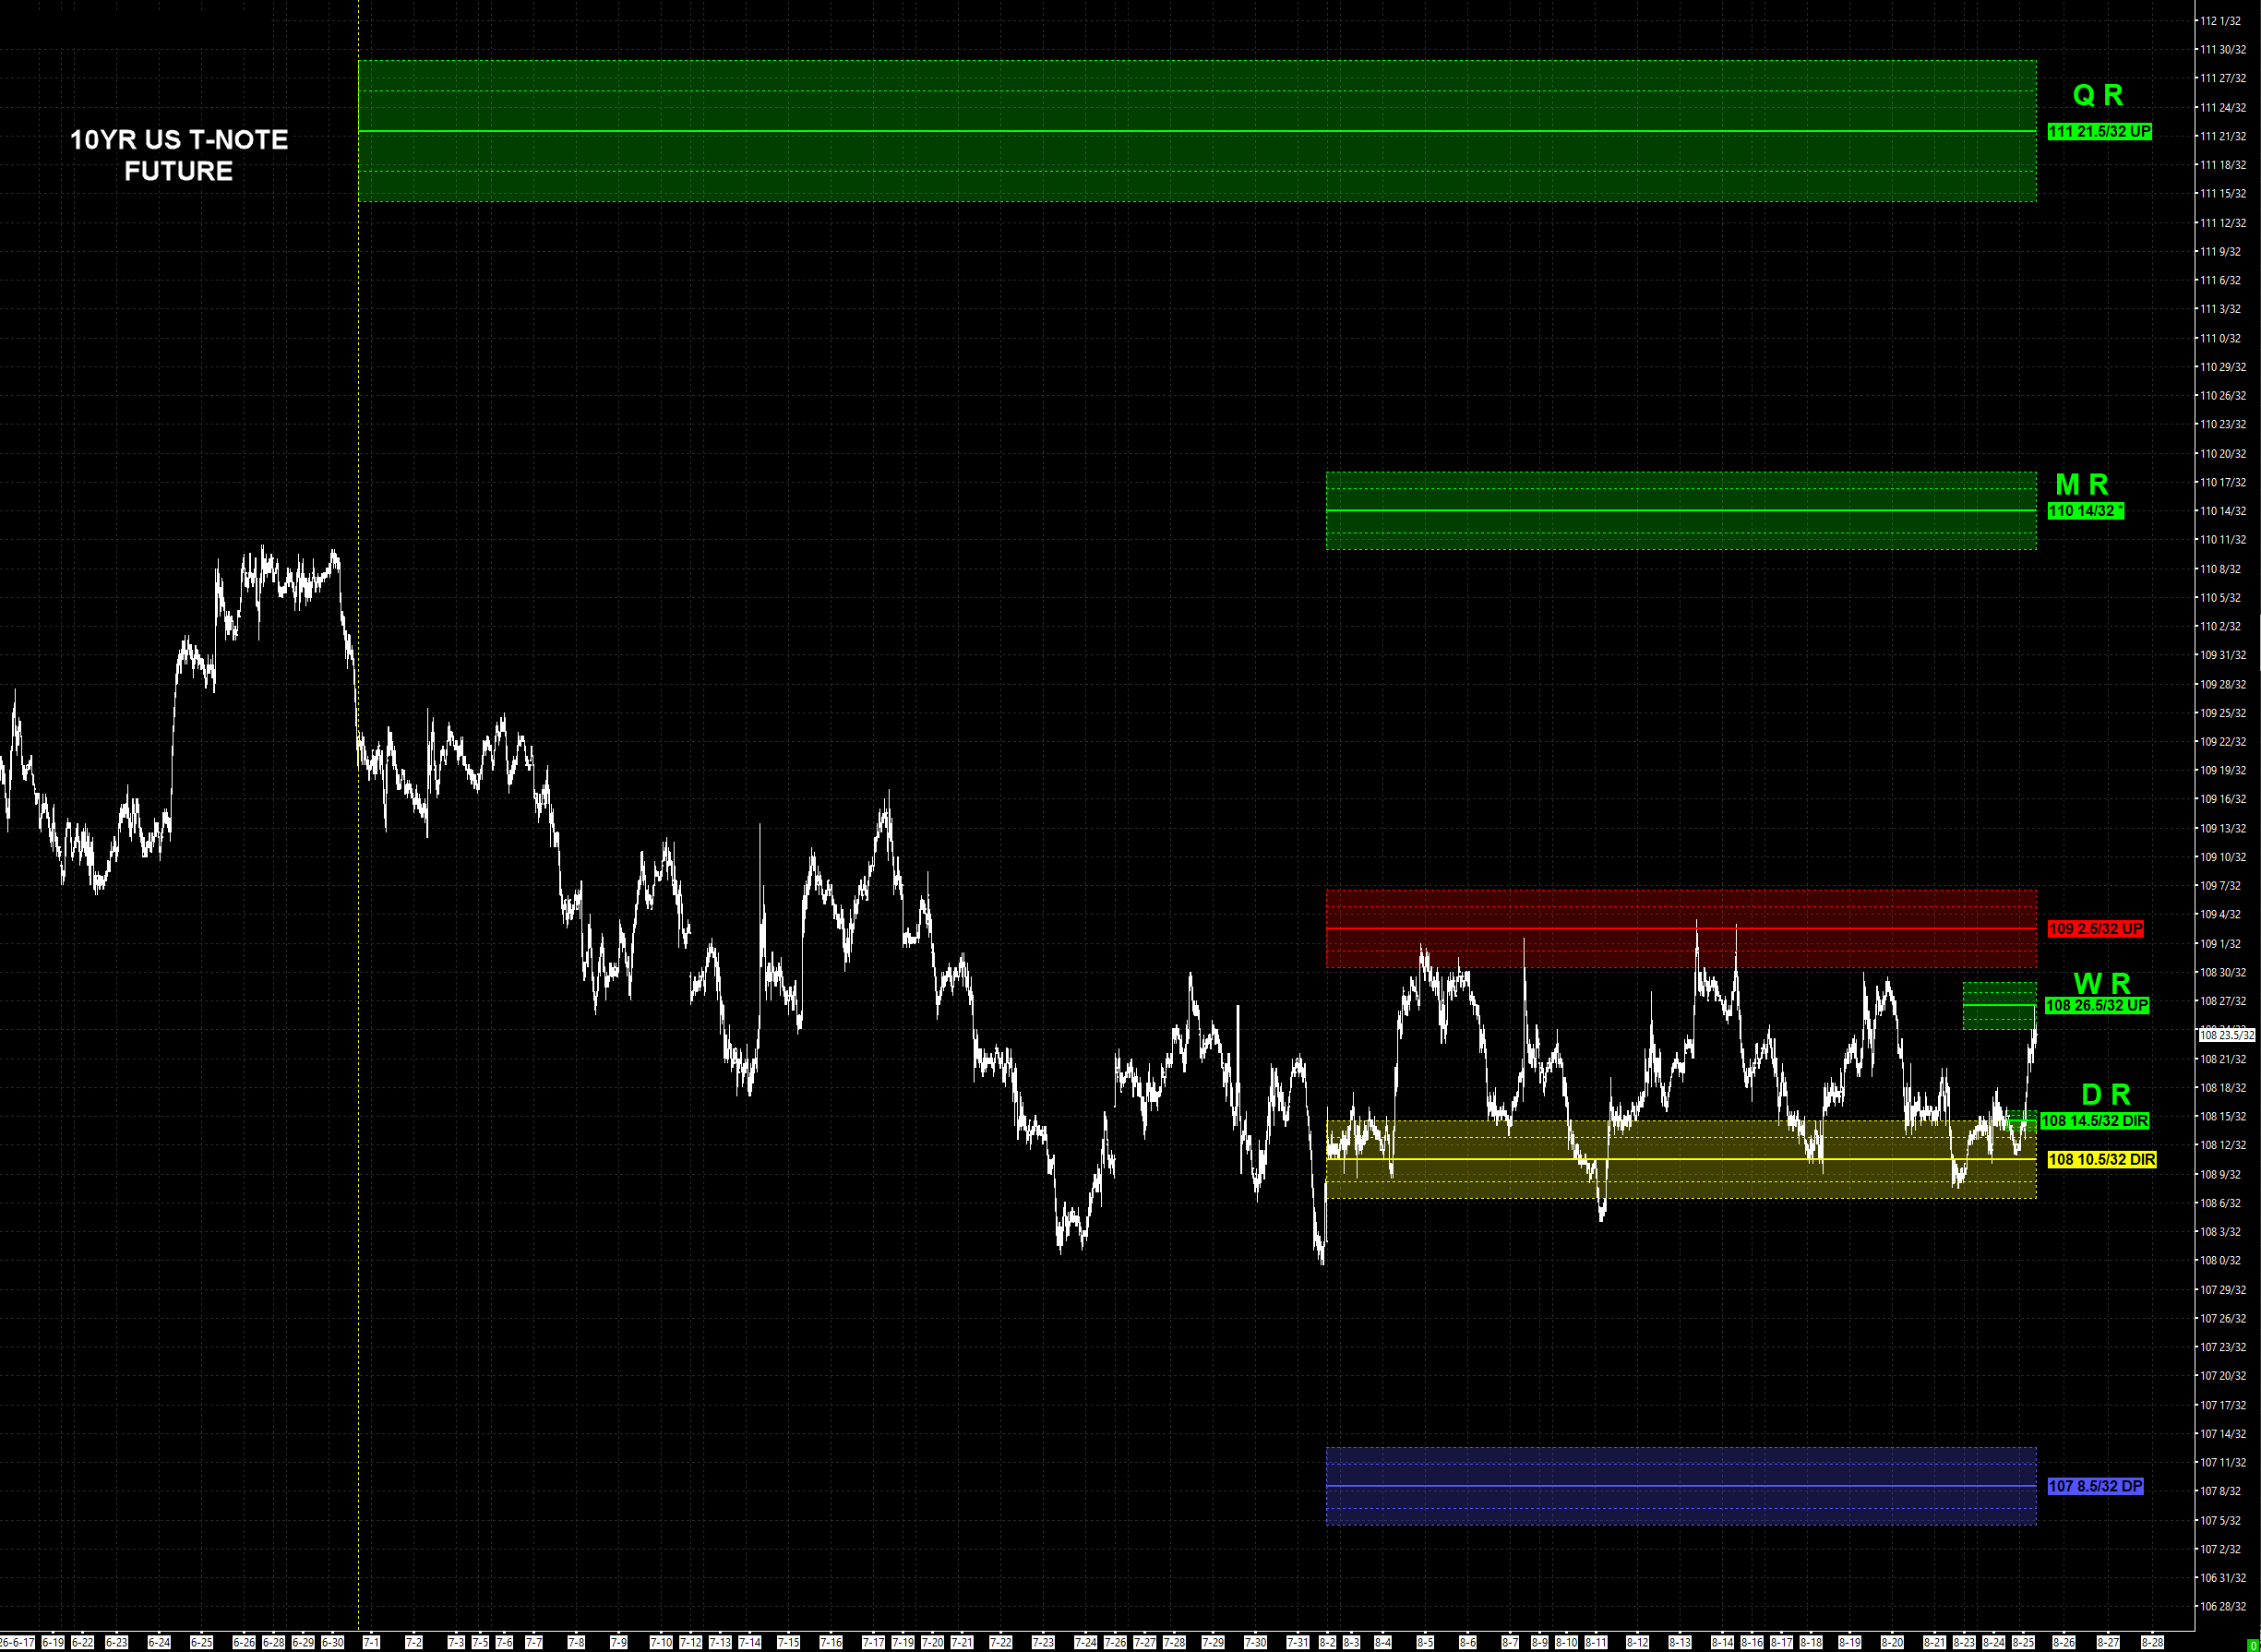
The 108-10 DIR is the pivotal line for the rest of the month. Today the daily R came in at 108-14.5 to start the session — the top of the monthly directional metric bands. Each level in the stack now carries a job:
This week the weekly R holds the decision. Capped below it, the corrective push fails: the week stays negative and the stop-and-go grind over 108-10 continues, with a stall rotating back to the daily R. Base above it and the transitional lean is real — but only validated above 109-02.5, and with conviction above 109-07, which is what opens the asymmetrical run toward the monthly R.
With the monthly winding down, the natural move is to lift to the quarterly — the longer-term foundation. The quarterly is always there as the bigger-picture perspective, and it is what the monthly is built on top of. Plot the same multi-time-frame sentiment on it and you get the longer-term read on what is setting up for next month.
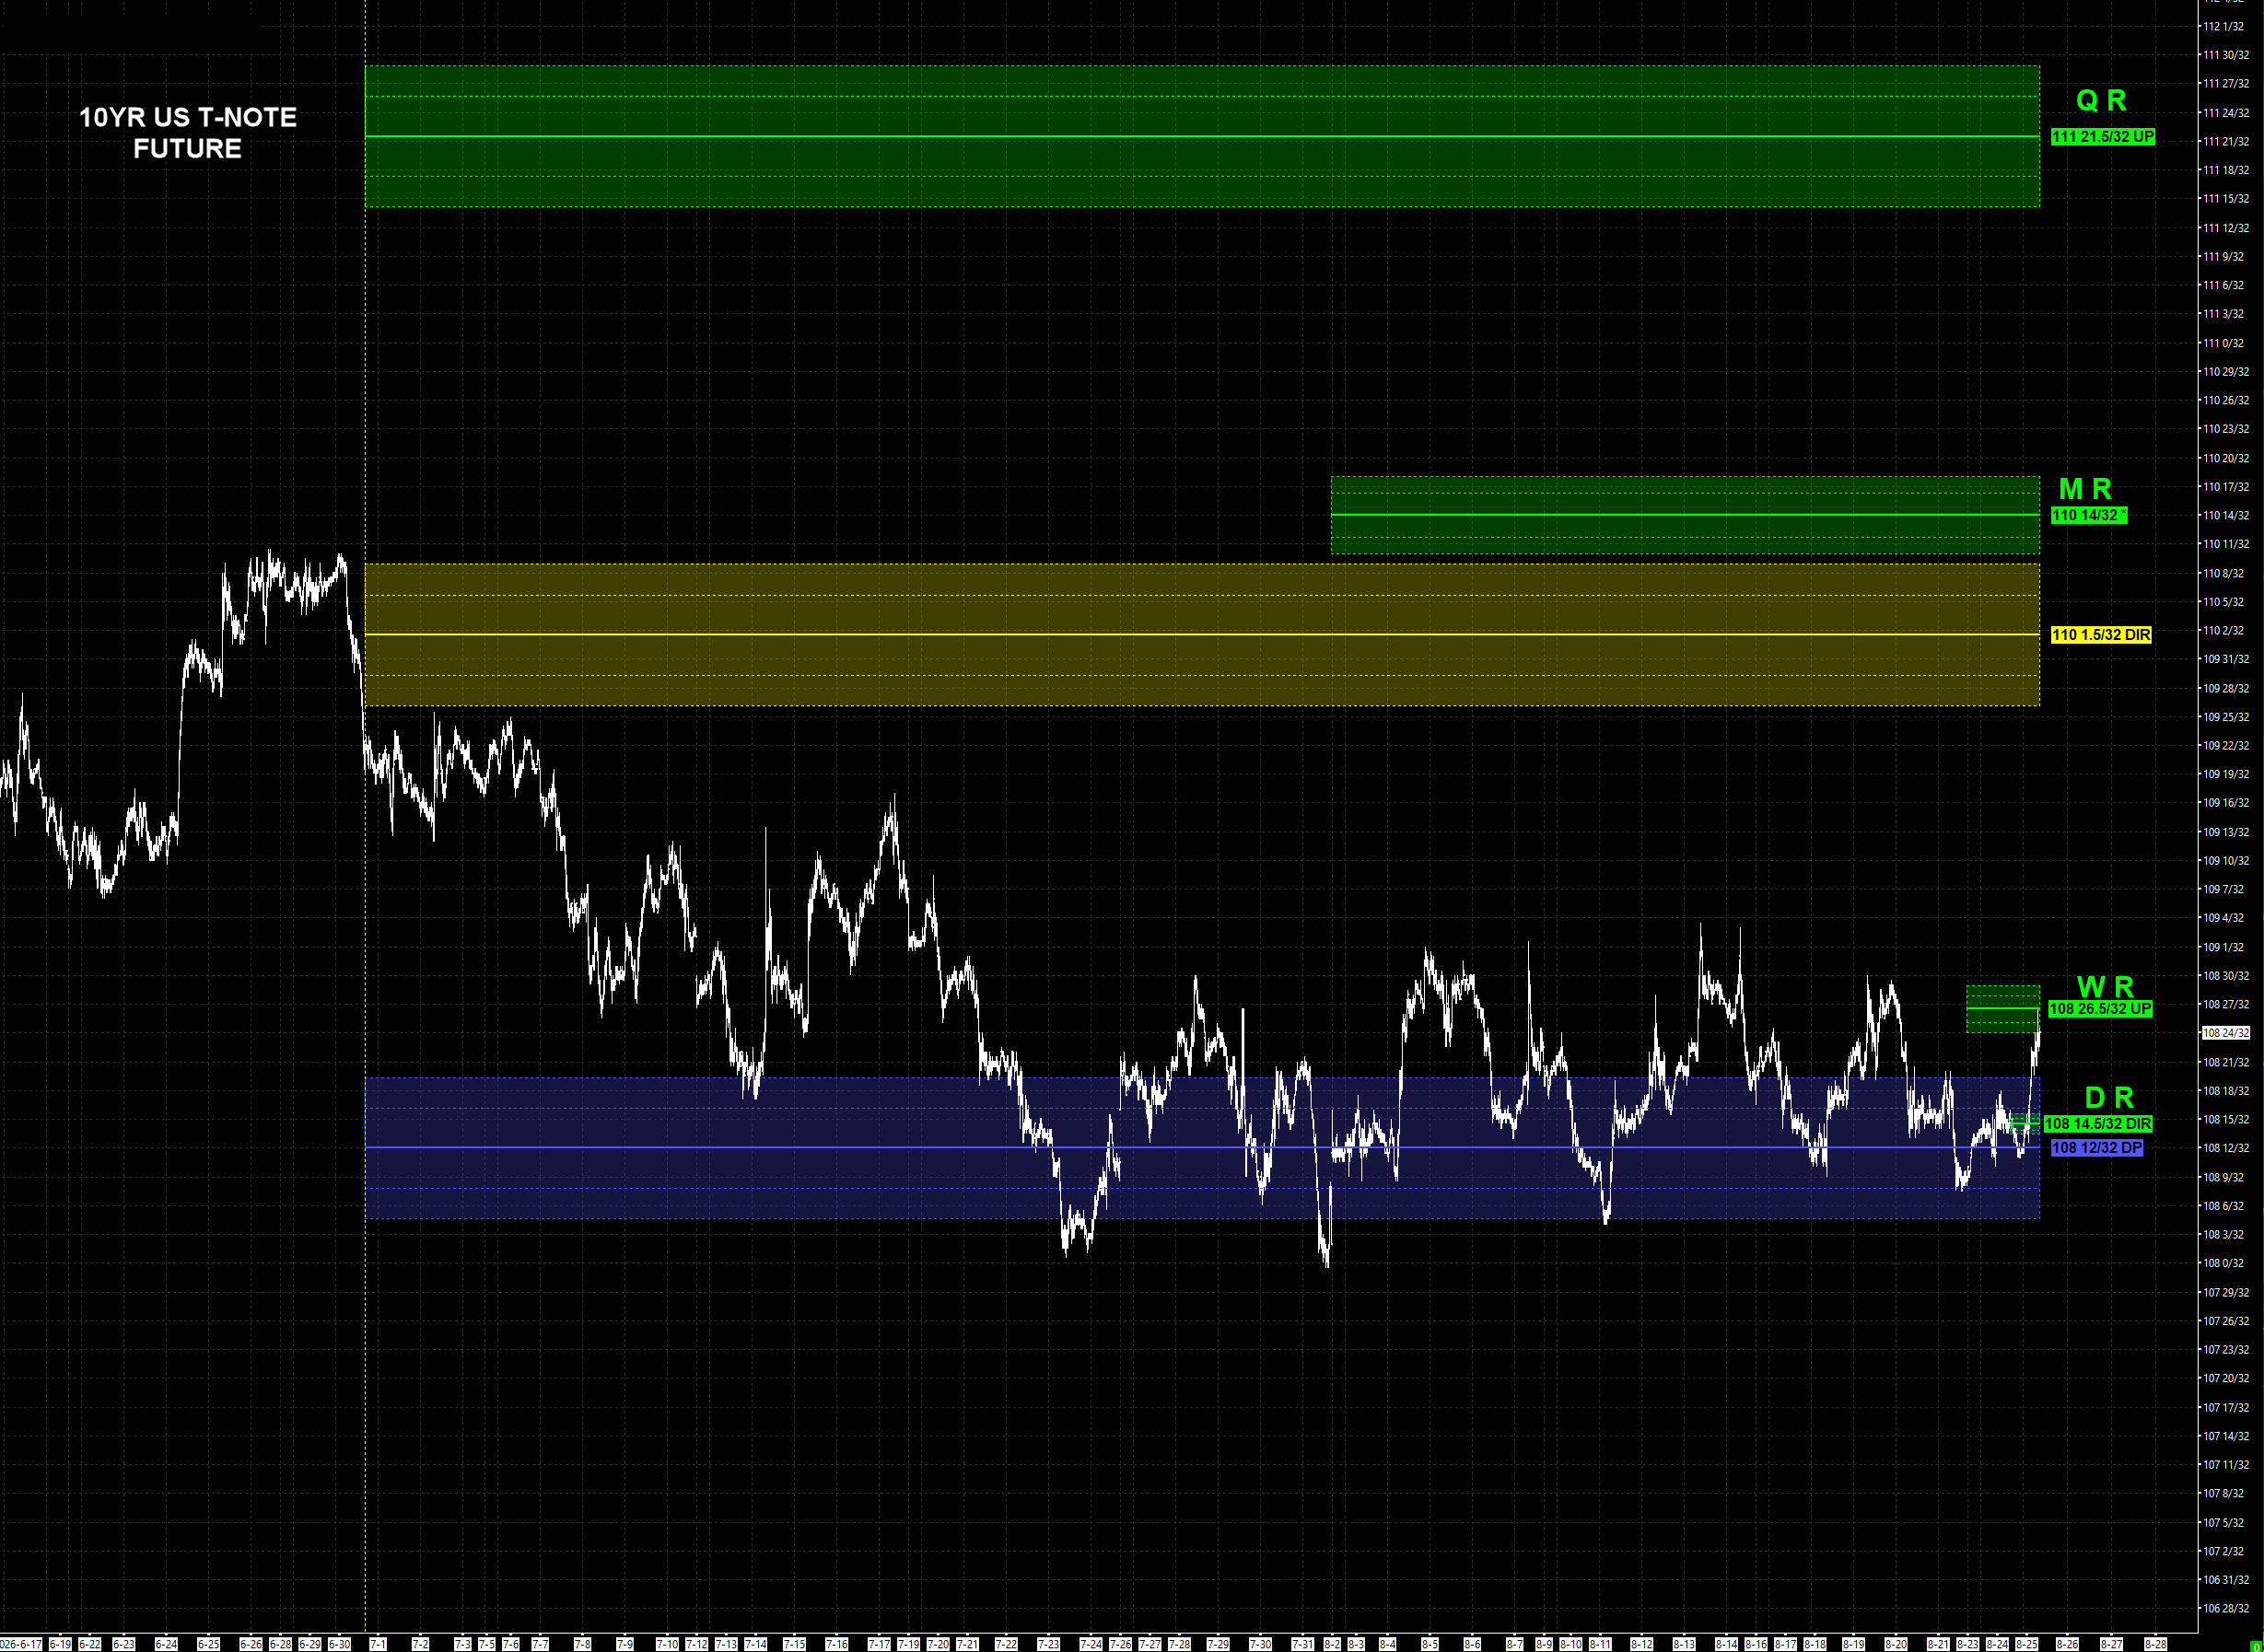
A note on when this matters most. Through the first and second quarters, having the quarterly structure during a monthly settlement is a real edge — it gives you the longer-term foundation exactly when the monthly is going quiet. At the end of a quarter, when the quarterly is itself in settlement, the relationship flips and the shorter time frames become the more important read. And the yearly sits above all of it as the macro picture — only unclear right at year-end, when the whole stack is rolling over into a new year, quarter, month and week at once.
The longer-term structure is where duration decisions get made. Do you lean on the 30-day or the 90-day sleeve? Which strikes line up with the structural returning points? The quarterly answers those before the monthly can.
Overlay the monthly inside the quarterly and the two frames line up: the monthly structure is in alignment with the quarterly. When two time frames agree, the structure is confirmed — and confirmed structure is what the market is more likely to respect.
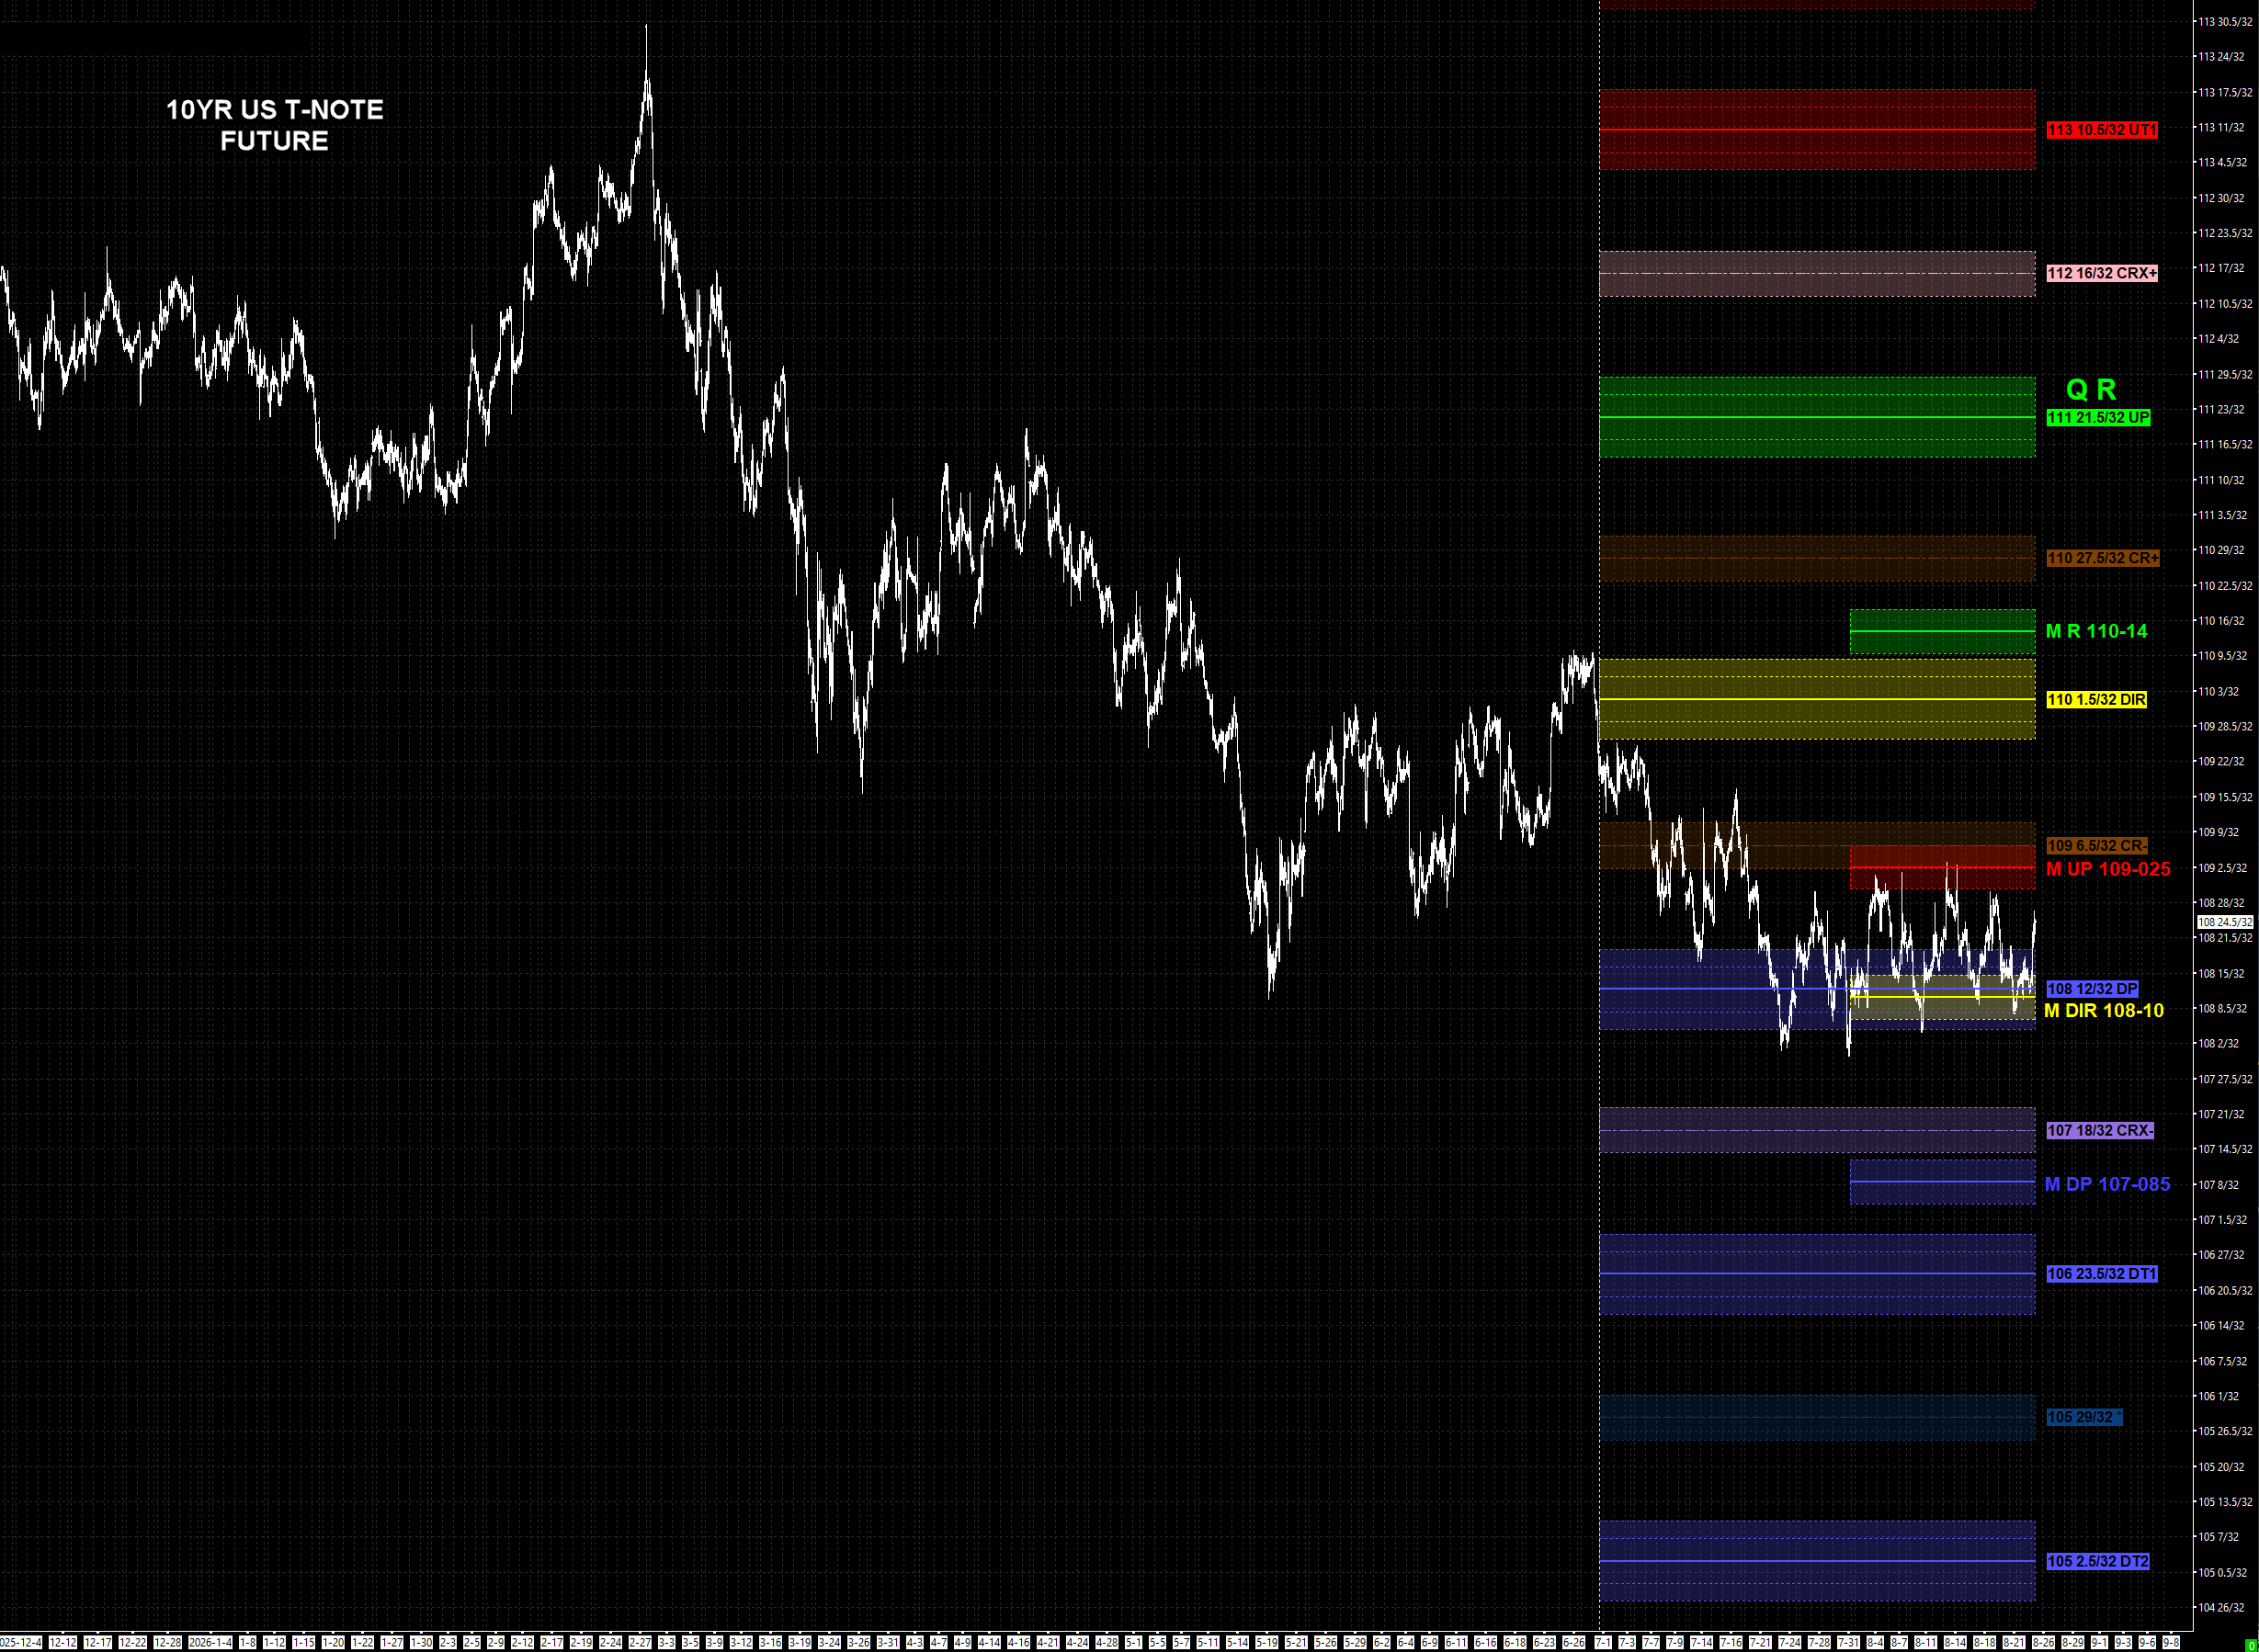
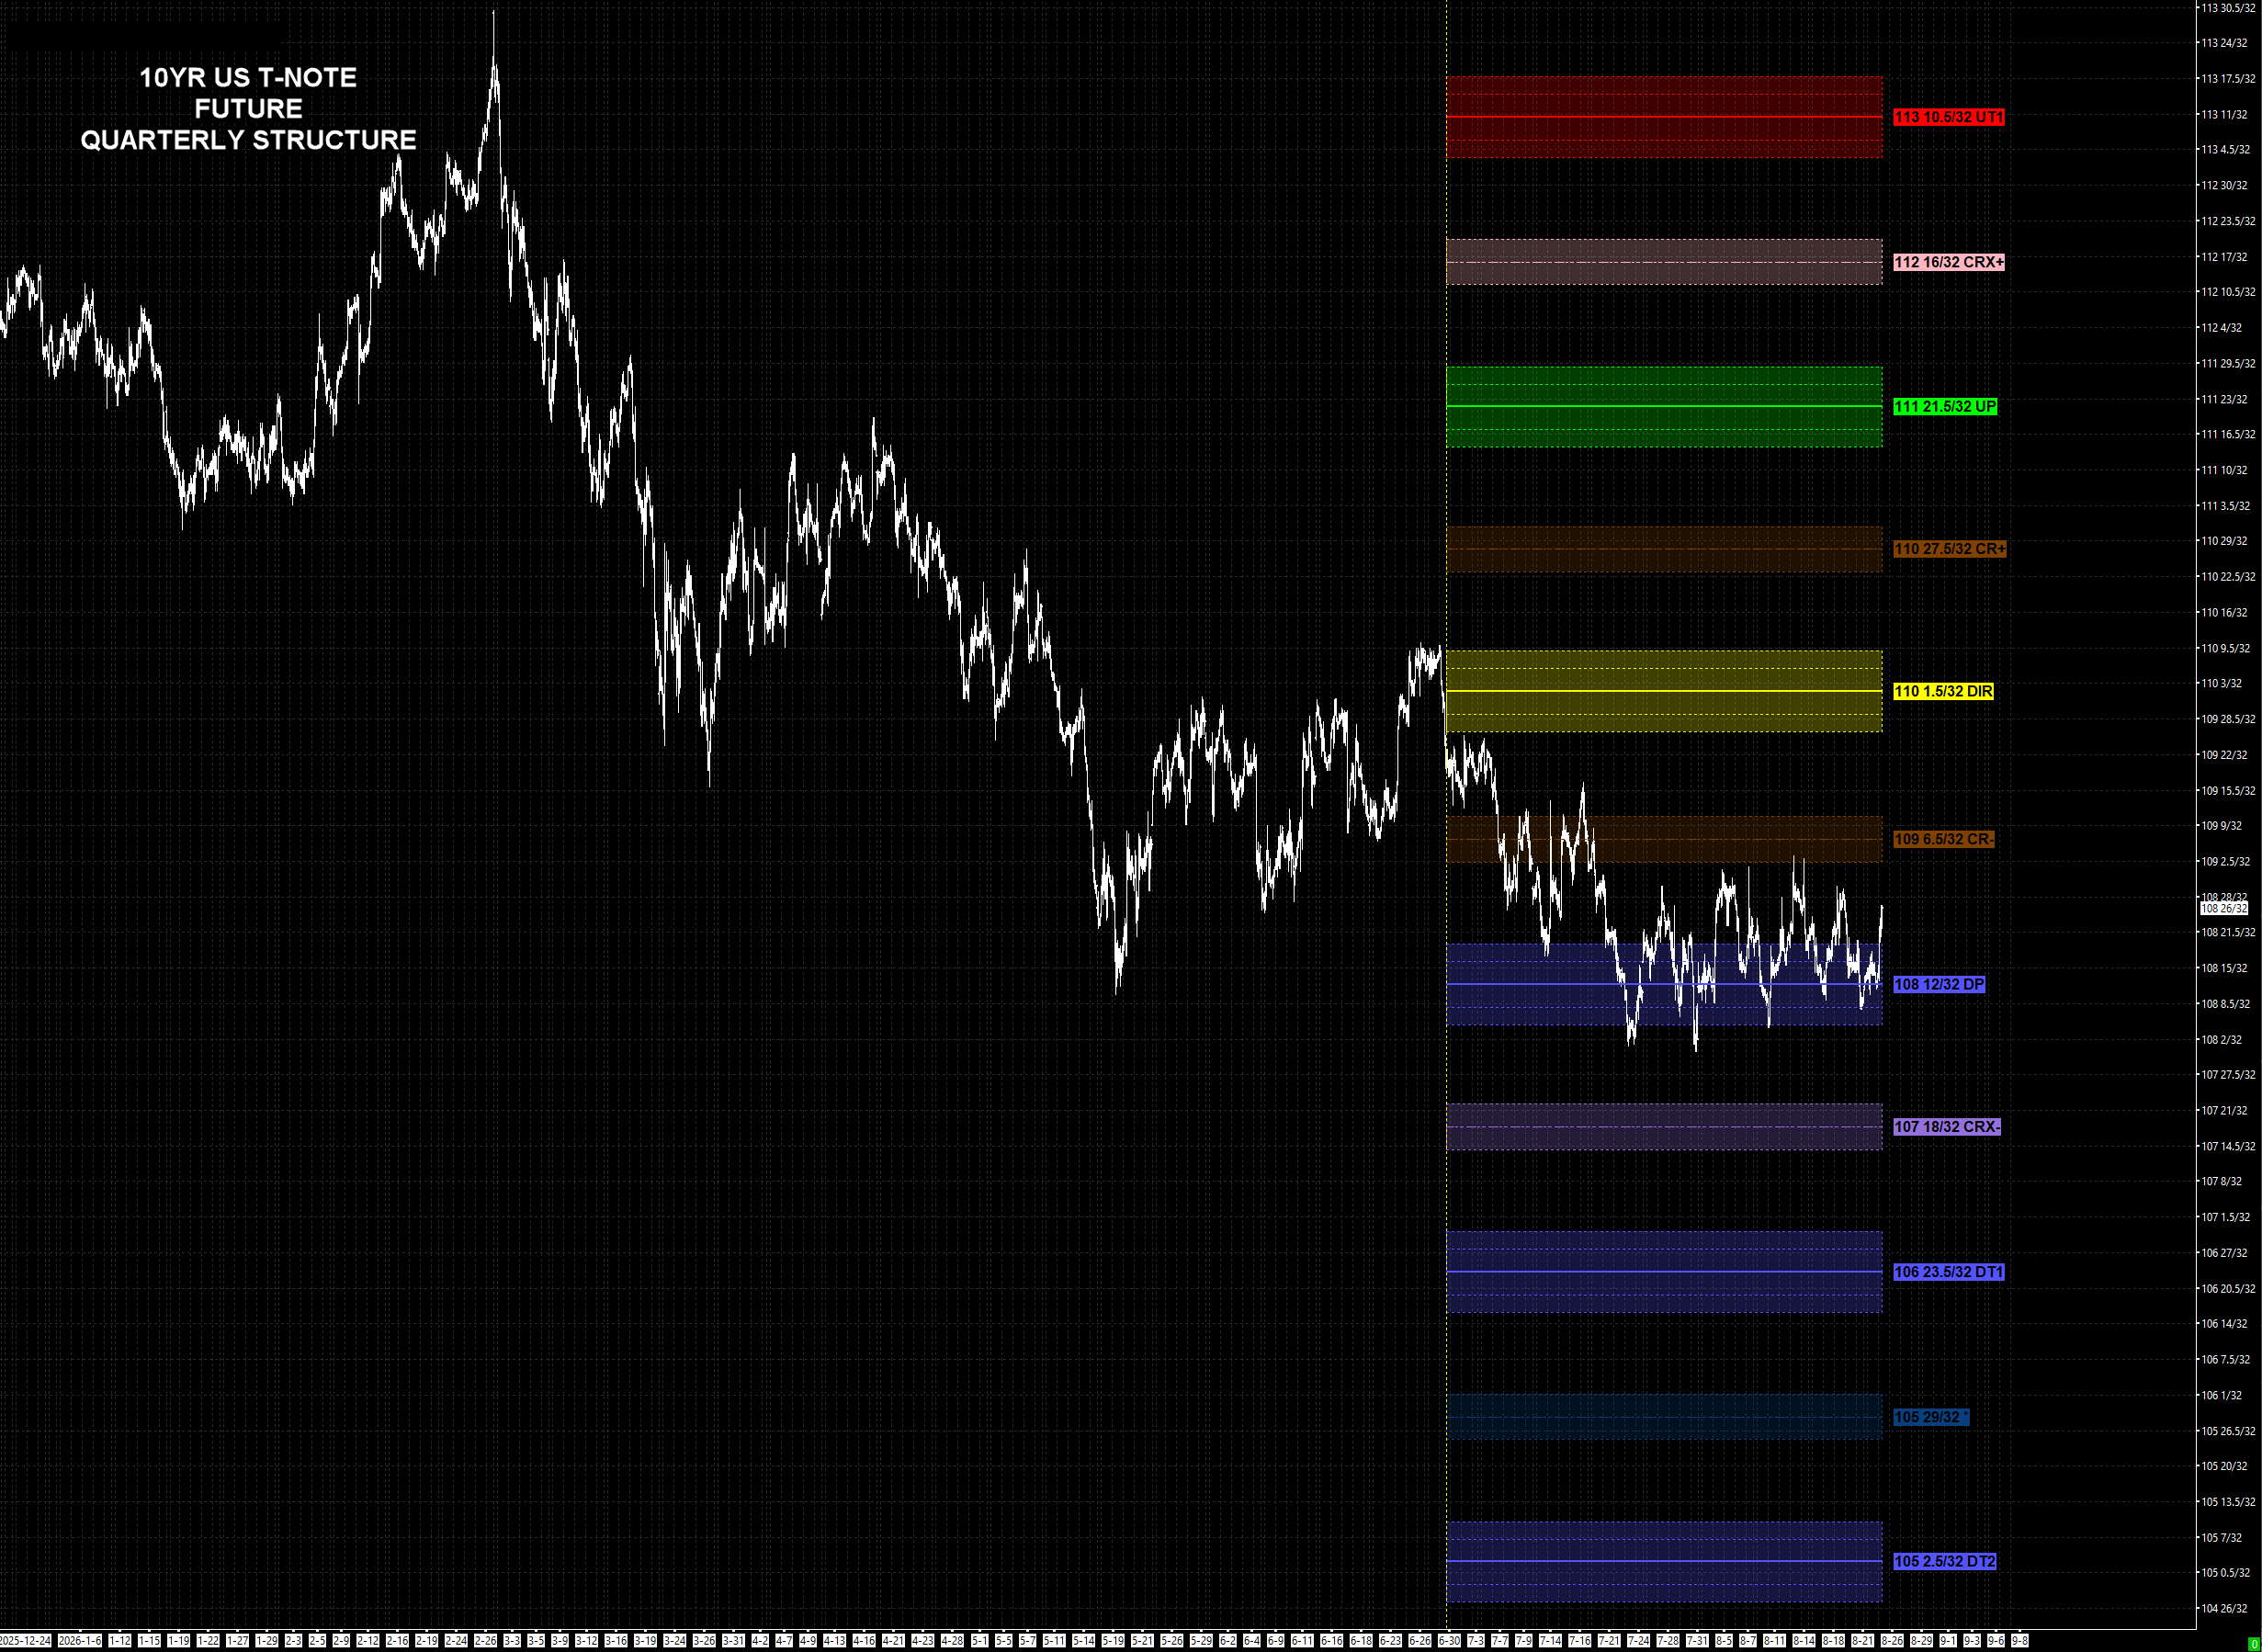
Pull the view back to the start of the year and the character is not subtle: the 10-Year has been in a negative downtrend — lower move lows, lower move highs. The most recent lower-low broke below the 108-12 quarterly DP, but could not hold below its metric boundary — it tried more than once. And every reaction back up was contained by the 109-06.5 CR-.
So on the quarterly, the market has been digesting with a negative lean on the lower end of the Quarterly Critical Range, while the monthly digests above its DIR, inside the Upside Pivot. That tension is the whole picture — and it hands us the magnitude of the what-if.
Here is what the tape is telling us. After that first trade below the DP, the market traded back up through the DP’s upper metric boundary — the big positive signal — and it did not follow through. No follow-through in either direction is a market being controlled, playing a waiting game; good reversals are fast, and this one is anything but. The move that finally breaks outside the CR- / DP band is the one that points the way — and it has room to be substantial.
The R Regime comes from where the R Level sits inside the map, and right now the whole stack reads the same way. Price is below R on both the quarterly and the monthly — a negative regime top to bottom. The higher time frame is in command: the quarterly is the commanding structure, with the monthly as the execution frame beneath it. That is who’s in charge until September writes a new monthly map to align inside the quarterly.
As long as price is below 109-06.5 — the monthly Upside Pivot’s upper metric boundary and the Quarterly CR- in one spot — the market stays in a difficult digest. The catalyst that may force the decision is the Jackson Hole Economic Symposium keynote on Friday. The risk is marked underneath, at 108-10: lose it and every time frame aligns to the downside. Above 109-06.5, then 110-01.5, is the path that flips the read the other way.
That is the value of reading the whole stack. No single time frame was going to tell you this. The daily gave the session’s momentum, the weekly gave the tell, the monthly gave the pivot, and the quarterly gave the magnitude. One map, four time frames — and now you know who’s in charge.
Every level here — the R Levels, the DIR, the Critical Range, the regime on each time frame — comes off the same PriceMap, and Navigator, our AI agent, reads the whole daily-through-quarterly stack in one place. You stay the operator; the structure does the work. See the Navigator → or how the map is built on the PriceMap page →